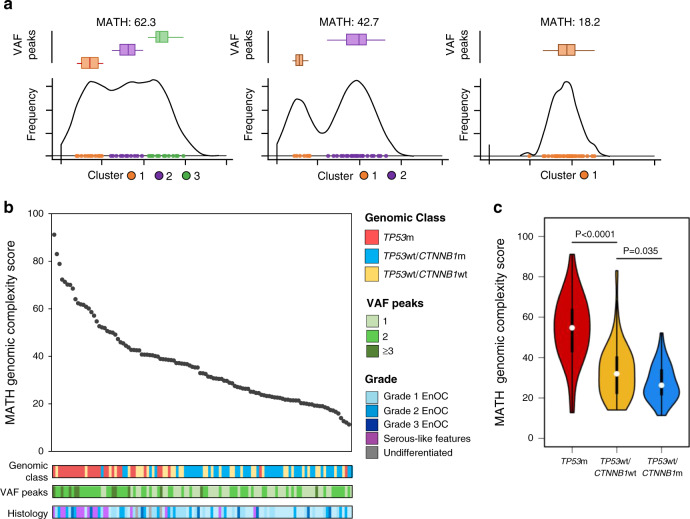
Fig. 4. Genomic complexity of endometrioid ovarian carcinomas (EnOC).
a Representative examples of variant allele frequency density plots for a high complexity tumour (left), intermediate complexity tumour (centre) and low complexity tumour (right). Variant allele frequency (VAF) clusters are shown and summarised within box plots above the density plot; boxes represent the 1st to 3rd quartile, with the median labelled as the central line, and whiskers extend to the data range from 1st and 3rd quartile +/−1.5 times the interquartile range. b Mutant-allele tumour heterogeneity (MATH) genomic complexity scores across all 112 endometrioid ovarian carcinoma (EnOC) cases, ranked high to low. c MATH genomic complexity scores across the three EnOC subtypes. Comparisons were made using the two-sided Mann–Whitney U-test without adjustment for multiple testing (P < 0.0001 and P = 0.0353). m mutant, wt wild-type.

