
Figure 2.
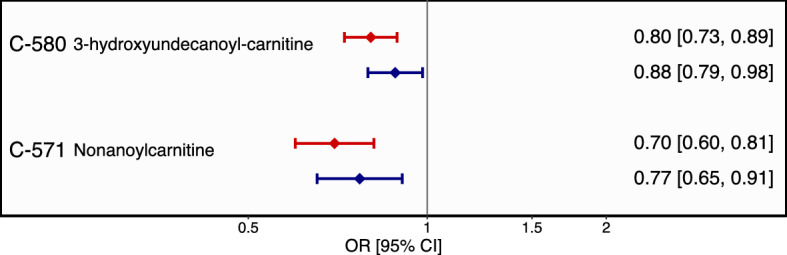
Associations of the replicated urinary metabolites and prevalent T2D in the combined sample (n = 1,424). Results from logistic regression adjusted for age, sex, cohort and urinary creatinine (red color) and with additional adjustment for BMI, HDL-cholesterol, triglycerides, systolic and diastolic blood pressure, hypertension and family history of diabetes (blue color). Error bars denote 95% CI around odds ratios per standard deviation increase in urinary metabolite level.