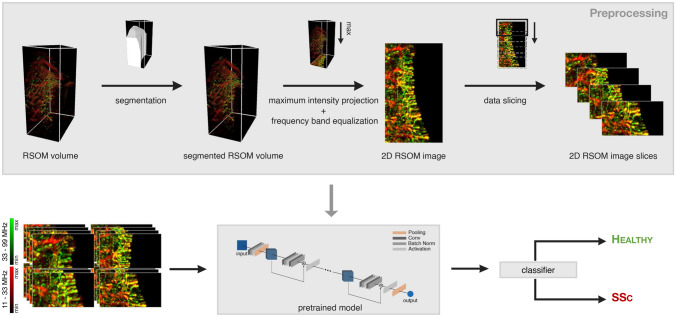
Figure 3.
Schematic of machine learning process. RSOM volume is segmented, an MIP is created and the resulting 2D image is sliced into multiple image slices. For each image slice a pretrained deep neural network, ResNet18, predicts whether it belongs to a healthy control or a patient with SSc. The final classifier aggregates the network output for the image slices per patient and computes the prediction score for each patient. The MIPs combine the low and the high frequency bands following equalization, with the high frequency image in green and the low frequency image in red.

