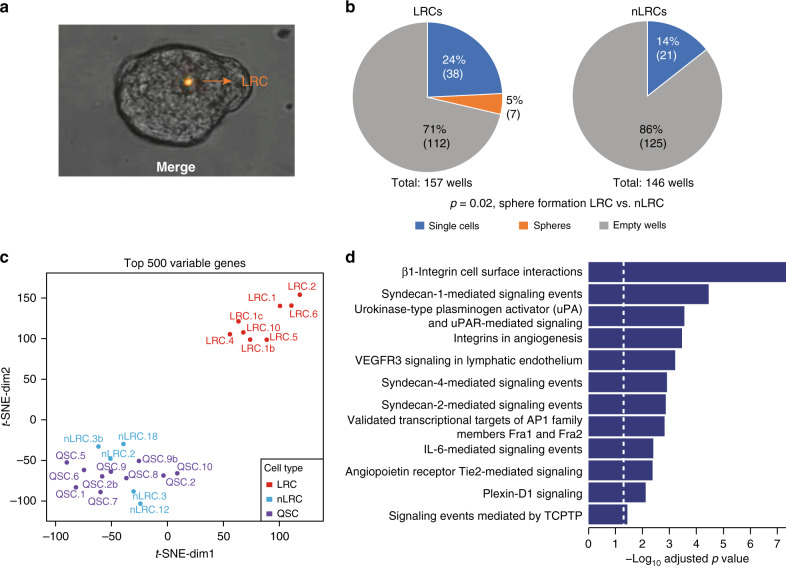
Fig. 2. IL6 pathway is activated in mammary stem cells.
a Representative picture of a mammosphere (day 7) generated from PKH26-labeled HMECs. b PKH26-labeled HMEC-mammospheres from four patients were disaggregated, sorted by flowcytometry into PKH26+ LRCs and PKH26- nLRCs, plated as single cell per well, and tested for sphere-formation. Shown is the percentage and in parentheses the respective absolute number of empty wells, wells with single cells and spheres after two weeks of mammosphere-culture (number of spheres vs. no spheres for LRCs vs. nLRCs, p = 0.02, two-sided Fisher’s exact test). c, d LRCs (n = 8), nLRCs (n = 5) and QSCs (n = 10) from three patients were subjected to single cell transcriptome microarray analysis. c t-SNE plot of the top 500 most variable genes. d Pathway analysis using the 216 genes differentially expressed between LRCs and the pooled nLRCs plus QSCs. See Supplementary Table 1 for patient/sample-ID allocation.

