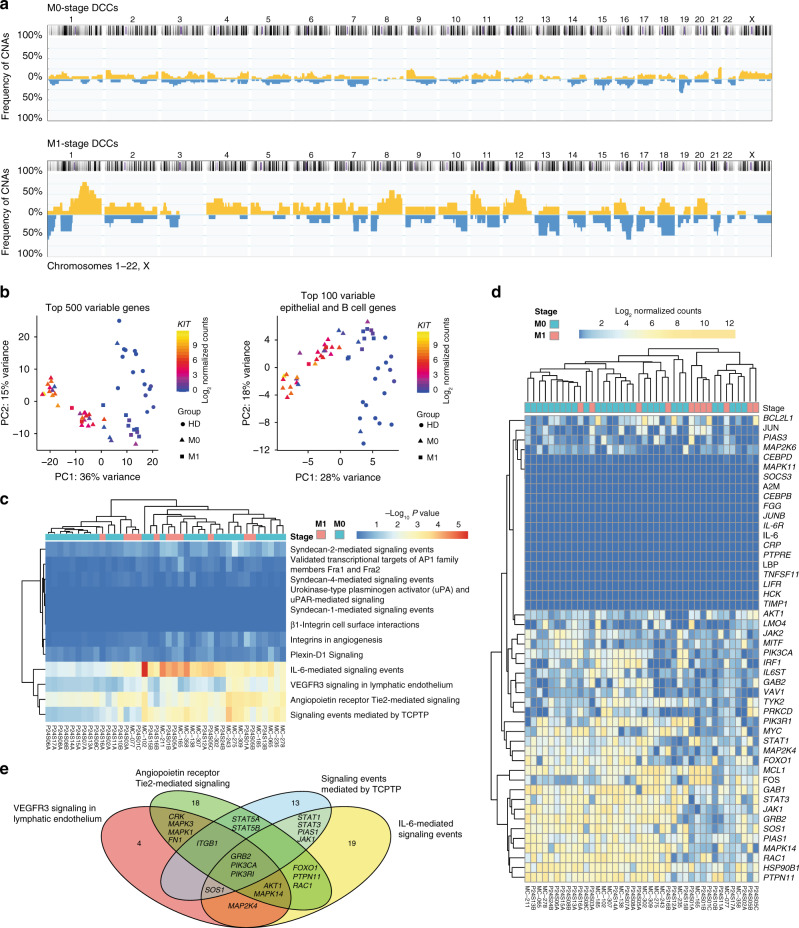
Fig. 3. IL6 pathway is activated in BM-DCCs of breast cancer patients.
a DCCs from BM of 21 non-metastasized (M0-stage, n = 30 DCCs) and five metastasized (M1-stage; n = 11 DCCs) breast cancer patients were analyzed for CNAs. The cumulative frequency of genomic aberrations is given in yellow and blue indicating genomic gains and losses, respectively. M0-stage (b, c n = 30; d, e n = 29 and M1-stage (n = 11) DCCs and EpCAM+ BM cells of seven healthy donors, i.e. patients without malignant disease (HD; n = 15 cells) were analyzed by single cell RNA sequencing. b Principal component analysis of the top 500 most variable genes or top 100 most variable epithelial and B cell genes. c DCCs were tested for enrichment in pathways identified to be enriched in LRCs over QSCs/nLRCs (see Fig. 2d). d The heatmap displays log2 normalized read counts of mRNA expression of IL6 signaling pathway genes as listed in the NCI-Nature PID expanded by the LIFR gene. e Venn diagram for the gene-members of the four pathways (d) that are expressed in at least half of bone marrow DCCs (except for the BMX (5/40) and CEBPD (19/40) genes, Supplementary Fig. 1d). Pathway-private genes are annotated by their number, shared genes are named explicitly (see also Supplementary Table 5). See Supplementary Table 1 for patient/sample-ID allocation.

