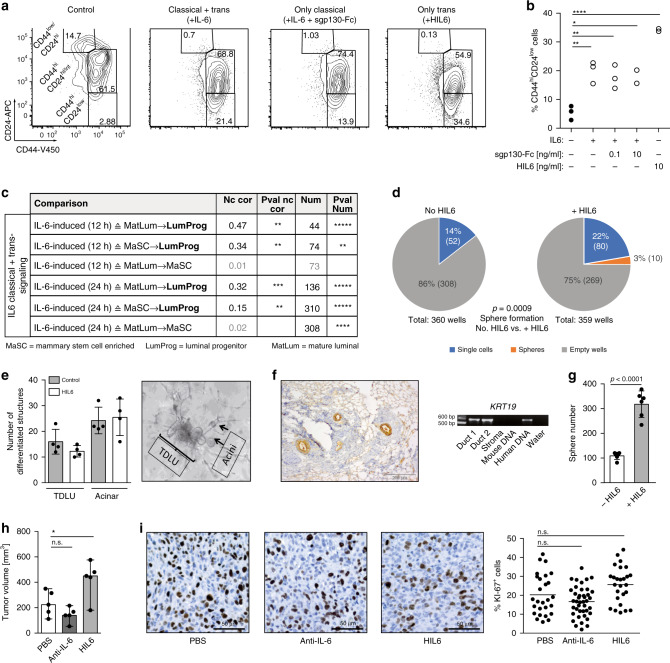
Fig. 5. IL6 trans-signaling endows non-stem cells with stem-like abilities.
a, b MCF 10A spheres were analyzed by flow cytometry for the expression of CD44 and CD24. The percentage of CD44hiCD24low expressing cells was determined. Data represent cumulative results of three independently performed experiments, each performed in triplicate. c Fold change correlation analysis comparing IL6-induced gene expression in MCF 10A cells at 12 and 24 h, respectively, with gene expression signatures of luminal progenitor (LumProg), mature luminal (MatLum), and mammary stem cell enriched cells (MaSC) according to the study of Lim et al.29. Nc cor: non-centered correlation between fold-changes, Num: number of common differentially expressed genes; d LRCs and nLRCs were sorted by flow cytometry from PKH26-labeled HMEC-spheres, nLRCs were plated as single cell per well (n = 3 patients) single-cell deposit determined by manual microscopic evaluation and cultured under mammosphere-conditions with or without HIL6. Sphere-formation and survival of single cells was determined after 14 days (p values are provided within d). Each patient-culture was set-up as duplicate in either freshly prepared or conditioned mammosphere-medium. As no significantly different outcome (Fisher’s exact test, p = 0.6 and p = 1 fresh vs. conditioned medium for cultures w/o HIL6 and with HIL6, respectively) was detected, results are presented as pooled analyses. e In vitro generation of acinar and tubular (TDLU) structures of primary HMECs cultured with or without HIL6 (each n = 4). f Primary HMECs cultured with HIL6 and transplanted into NSG-mice. Staining for human cytokeratin 8/18/19 of the transplanted area eight weeks post-transplantation. PCR specific for human KRT19 of two microdissected cytokeratin 8/18/19-positive ducts and one cytokeratin 8/18/19-negative stromal area. Pure mouse or human DNA was used as control. g MDA-MB-231 cells were cultured as spheres in the absence (n = 6) or presence of HIL6 (n = 6). h Tumor volume of 20,000 MDA-MB-231 cells pre-treated for 3 h with PBS, an anti-IL6 antibody or HIL6 and transplanted into NSG-mice (n = 5). All mice were analyzed at the same day after tumor cell inoculation; n.s. = non significant. i TissueFAX cytometric quantification of tumors from panel (h) for the percentage of Ki-67-positive cells. n = 27, 41, or 26 regions (0.25 mm2 each) for PBS, anti-IL6 or HIL6. P values in panel b, h, i: one-way ANOVA with Dunnett’s multiple comparisons test (post hoc); c P values according to two-sided Student’s t-distribution for (transformed) Nc cor and hypergeometric testing for Num; d two-sided Fisher’s exact test; g two-sided Student’s t test; asterisks indicate significance between groups in multiple comparisons (*p < 0.05, **p < 0.01, ***p < 0.001, ****p < 0.0001, *****p < 0.00001). All error bars correspond to standard deviation (Mean ± SD). See Supplementary Table 1 for patient/sample-ID allocation. Source data for (c) are provided in the Supplementary Table 6.

