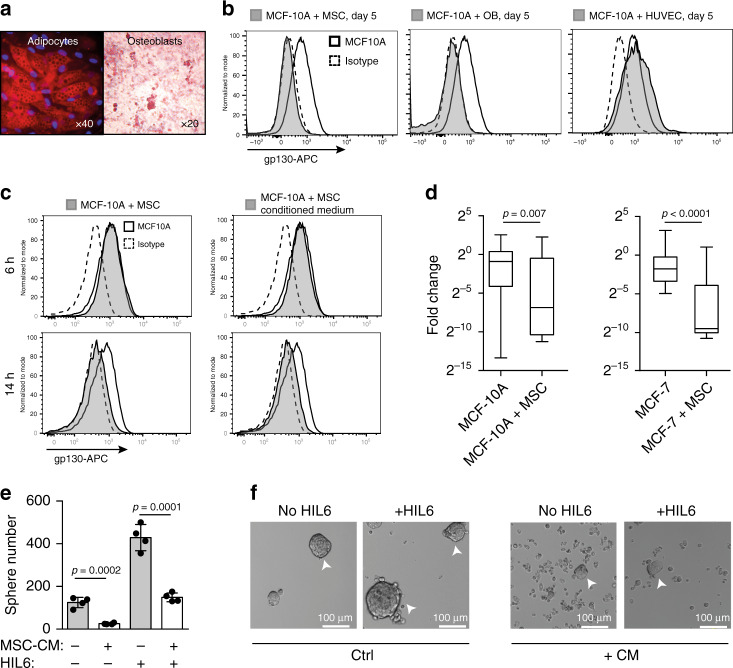
Fig. 6. gp130 downregulation by soluble factors of bone marrow stromal cells.
a Mesenchymal stem cells were tested for their ability to differentiate in vitro into adipocytes (Nil oil red O staining) and osteoblasts (Alizarin red S staining). b Surface gp130 expression of MCF 10A after five days of co-culture with primary mesenchymal stem cells (MSCs) from a breast cancer patient, primary osteoblasts (OBs) derived thereof or primary human umbilical vein endothelial cells (HUVECs). c Surface gp130 expression of MCF 10A after 6 and 14 h of co-culture with MSCs or MSC-conditioned medium. b, c Grey filled histograms indicate MCF 10A co-cultured with MSCs, OBs, HUVEC or MSC-conditioned medium. Histograms with a thick black line indicate MCF 10A cells cultured alone and dashed histograms isotype control staining for gp130. d gp130 gene expression levels determined by single cell qPCR of MCF 10A cultured for 5 days with (n = 23) or without (n = 37) MSCs and MCF- 7 cultured for 5 days with (n = 20) or without (n = 20) MSCs. Box and whisker plots show the MCF 10A (MCF-7) fold change cultured with MSCs relative to MCF 10A (MCF-7) cultured without MSCs with boxes marking the median, lower-quartile, and upper-quartile, and lines connecting the extremes. e, f MCF 10A cells were left untreated or pre-treated for 14 h with MSC-conditioned medium, washed and then tested for their ability to form spheres in the presence of endogenously produced IL6/sIL6RA or exogenously added HIL6. Sphere-formation was assessed after seven days, n = 4 for each group. P values according to two-sided Mann–Whitney test (d) or two-sided Student’s t-test (e). All error bars correspond to standard deviation (Mean ± SD).

