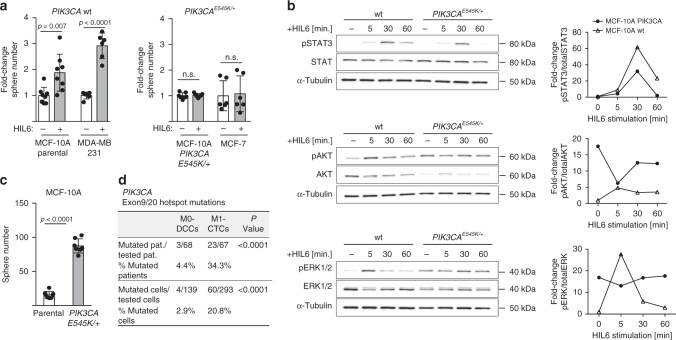
Fig. 7. PIK3CA pathway activation confers independency from IL6 signaling.
a Fold change in sphere numbers of pre-malignant (MCF 10A) and tumorigenic cell lines (MCF-7, MDA-MB-231) without (MCF 10A parental, n = 8; MDA-MB-231, n = 6) or with mutational activation of PIK3CA (MCF 10A PIK3CAE545K/+, n = 7; MCF-7, n = 6) cultured in the presence or absence of HIL6. Note that MCF 10A PIK3CAE545K/+ cells are isogenic to MCF 10A parental; n.s. = non-significant. b Western blot analyses showing phosphorylation of STAT3Tyr705, AKTSer475 and ERK1/2Thr202/Tyr204 in MCF 10A or MCF 10A PIK3CAE545K/+ cells cultured without or with HIL6 for the indicated time. For quantification, the signal of the phosphorylated protein and total protein was normalized to α-tubulin, then the ratio of phosphorylated to total protein was calculated. The graphs show the fold change in signal ratio over time relative to the control (unstimulated MCF 10A wt = 1). c Sphere numbers of the isogenic cells MCF 10A parental (n = 8) and MCF 10A PIK3CAE545K/+ (n = 7) cultured in the absence of HIL6. d Cytokeratin 8/18/19+ DCCs from BM of non-metastasized (M0-stage) HR-positive breast cancer patients and CD45-/EpCAM+/cytokeratin 8/18/19+ CTCs isolated from peripheral blood of metastasized (M1-stage) HR-positive breast cancer patients were sequenced for hotspot-mutations in PIK3CA (Exon 9: E545K, E542K; Exon 20: H1047R, H1047L, M1043I). P values in a, c two-sided Student’s test; d two-sided Fisher’s exact test. All error bars correspond to standard deviation (Mean ± SD).

