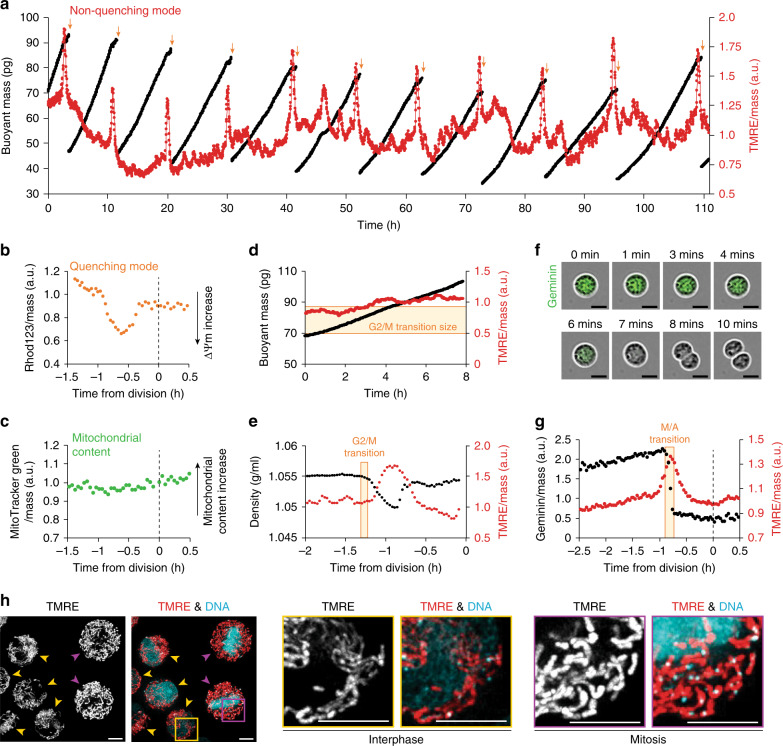
Fig. 1. Mitochondria transiently hyperpolarize during the prophase and metaphase.
a Buoyant mass (black) and mass-normalized TMRE (red) trace for a single L1210 cell and its progeny over ten full generations with a measurement interval of 1.9 min. At each cell division (orange arrows), one of the daughter cells is randomly kept and monitored, while the other is discarded. TMRE was used in a non-quenching concentration (10 nM). b Mass-normalized Rhod132 trace for a L1210 cell around cell division. Cells were loaded with a quenching concentration of Rhod123 (10 µM), washed, and immediately analyzed with no Rhod123 in the culture media. In the quenching mode, the fluorescence signal behavior is reversed. c Mass-normalized MitoTracker Green (50 nM) trace for a L1210 cell around cell division. d Buoyant mass (black) and mass-normalized TMRE (red) trace for a L1210 cell treated with 2.5 µM RO-3306 to inhibit mitotic entry. The typical size for mitotic entry is illustrated with a light-yellow area. e Cell density (black) and mass-normalized TMRE (red) trace for a L1210 cell around cell division. Mitotic entry (G2/M transition) is illustrated with a light-yellow area. f Representative phase contrast (gray) and mAG-hGeminin cell cycle reporter (green) images of a L1210 FUCCI cell in mitosis. Experiments were repeated four times independently with similar results. Scale bars: 10 µm. g Mass-normalized mAG-hGeminin (black) and mass-normalized TMRE (red) trace for a L1210 FUCCI cell around cell division. Metaphase-to-anaphase transition (M/A transition) is illustrated with light-yellow area. h Representative maximum intensity images of live L1210 cells stained with TMRE (red) and PicoGreen (DNA stain, teal). Yellow arrowheads indicate interphase cells, purple arrowheads indicate mitotic cells. Scale bars: 5 µm. Experiments were repeated four times independently with similar results.

