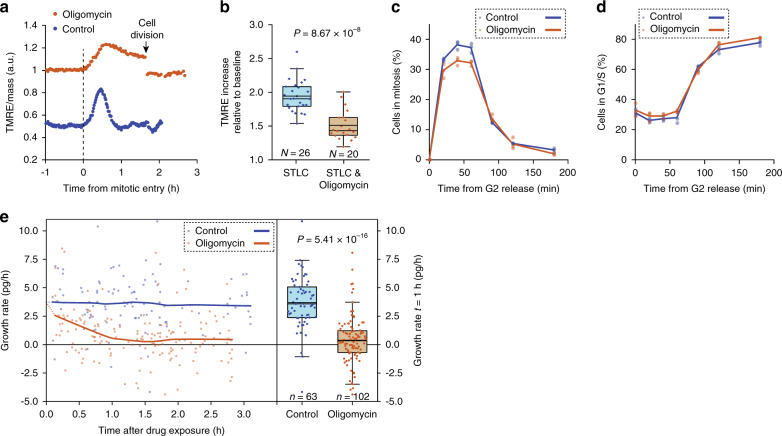
Fig. 3. Mitochondrial ATP synthase activity is required for cell growth, but not for cell division.
a Mass-normalized TMRE trace for control (blue) and 1 µM oligomycin-treated (brown) L1210 cell around cell division. Both control and oligomycin-treated cells proceed through mitosis, but display distinct TMRE dynamics. b Quantifications of the TMRE increase in mitosis following mitotic arrest with STLC in control and 1 µM oligomycin-treated L1210 cells. Baseline refers to G2 TMRE levels. c Quantifications of mitotic entry in control (0.1% v/v DMSO-treated) and 1 µM oligomycin-treated L1210 cells. Cells were synchronized to G2, released and collected for cell cycle analysis at indicated timepoints. Treatments were started 15 min before releasing from G2 arrest. Each dot represents a separate culture (n = 3). d Quantifications of mitotic exit (appearance of G1 cells) for samples shown in (c). e Quantification of mass accumulation (growth) rate in individual control and 1 µM oligomycin-treated cells. Each dot represents the growth rate of a single-cell. Quantifications of the growth rates after 1 h drug exposure are shown on the right. In (b, e), boxplots depict the mean (small square), median (horizontal bar), interquartile range (IQR) (box), and 1.5× IQR (whiskers). Unpaired, two-tailed Student’s t test was used for statistical analysis.

