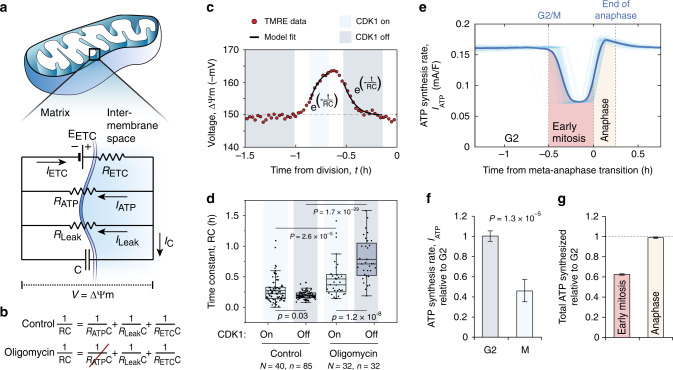
Fig. 4. Electrical circuit model reveals decreased mitochondrial ATP synthesis in early mitosis.
a, b Electrical circuit model of mitochondria, where ∆Ψm is the voltage across the circuit (a). The key components controlling ∆Ψm (ETC, ATP synthase, and leakage), all have their respective resistances (RETC, RATP, and RLeak), which together form the total resistance (R) in the circuit (b). Oligomycin increases the RATP value to infinity. The difference in R values between control and oligomycin-treated cells reflects the RATP value. c Model fit to a typical L1210 single-cell TMRE data. TMRE signals were converted to approximate voltages and CDK1on (light blue) and CDK1off (dark blue) regions were fitted separately to derive the time constant (RC) values for each state. d Time constant (RC) values for CDK1on (light blue) and CDK1off (dark blue) regions in control and 1 µM oligomycin-treated L1210 cells. Data depict the mean (small square), median (horizontal bar), interquartile range (IQR) (box), and 1.5× IQR (whiskers). Statistical significance was assessed using one-way ANOVA followed by Sidakholm test. N denotes the number of independent experiments, n denotes the number of cells. e ATP synthesis rate (IATP) for 85 separate L1210 cells around cell division. Individual cells are drawn with thin opaque lines; the population average is drawn with a thick solid line. The colored areas reflect total amounts of ATP synthesized during early mitosis (red) and anaphase (light yellow). f Quantifications of relative ATP synthesis rates (IATP) in G2 (dark blue) and mitosis (light blue) as modeled on a single-cell level in non-arrested cells. G2 rates were obtained using RC values for CDK1 off, and the ∆Ψm observed prior to mitotic entry. Unpaired, two-tailed Student’s t test was used for statistical analysis. g Quantifications of the total ATP synthesized by mitochondria during early mitosis (from G2/M to M/A transition, red) and during anaphase (light yellow), when compared to a null-hypothesis where ATP synthesis rate remains at G2 levels throughout mitosis (dashed horizontal line). For panels (f, g), data depict mean ± SEM (see Supplementary Note 8 for error analysis), and the data are the same as in panel (d).

