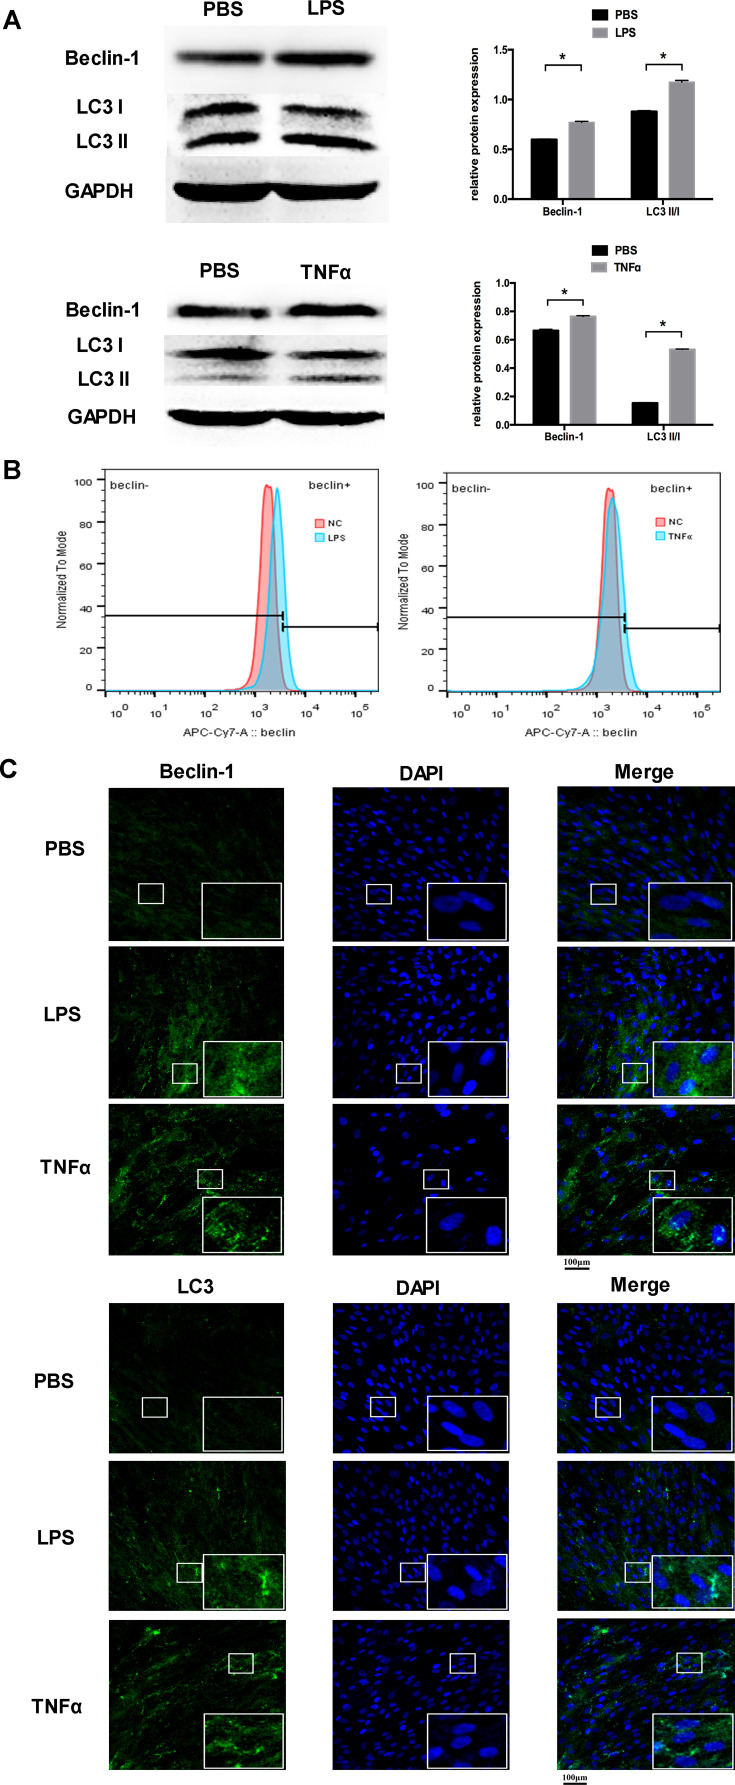
Figure 1.
Inflammation increased the level of autophagy in PDLCs. Cells were treated with LPS or TNFα for 24 h. (A) Western blot analyses of Beclin-1 and LC3II/LC3I. Histograms show quantification of the band intensities. (B) The flow cytometric results of Beclin-1. (C) Images of Beclin-1 and LC3 immunofluorescence staining. Scale bar, 100μm. (Analysis of variance *P <0.05; n=9 replicates derived from three donors).

