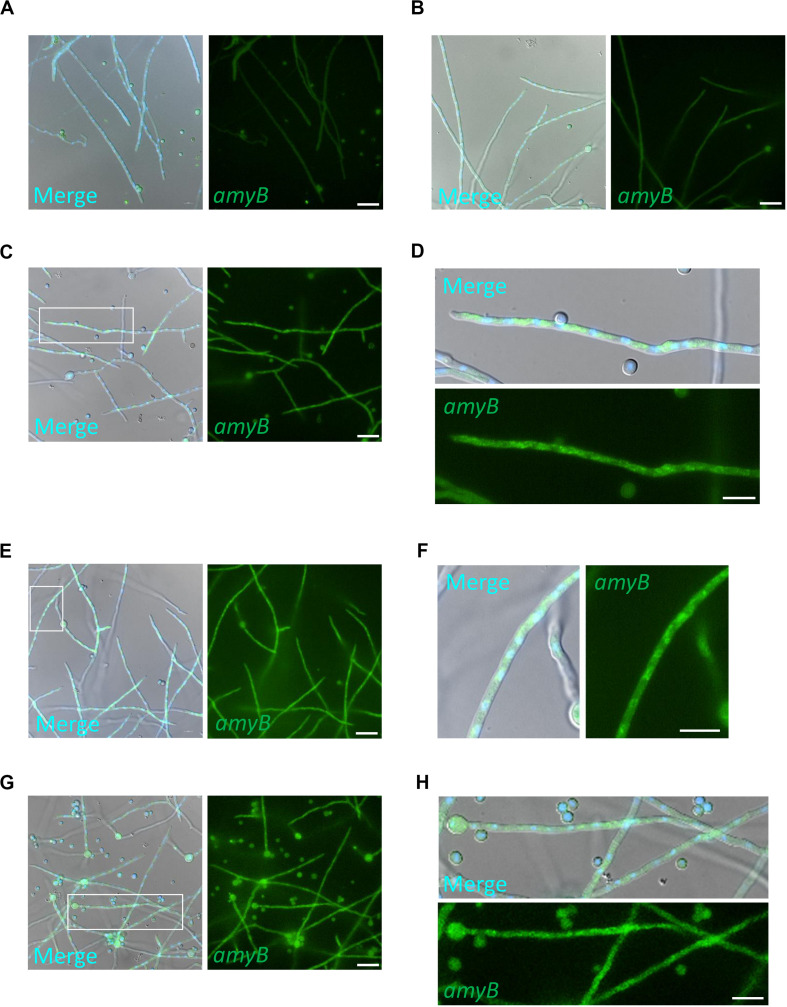
FIGURE 3.
Expression of amyB mRNA by shifting media from CD to CDmal. smFISH was performed with the amyB probe in cultures of CD before shifting (A) and after shifting to CDmal, at 30 min (B), 60 min (C,D), and 90 min (E–H). Note that amyB fluorescent signals were observed through the hyphae (E,G). The images in (D,F,H) are magnifications of the regions within the white rectangles in (C,E,G), respectively. These enlarged images show amyB fluorescent signals in the apical (D), intermediate (F) and basal regions (H). Scale bars, 20 μm (A–C,E,G) and 10 μm (D,F,H).

