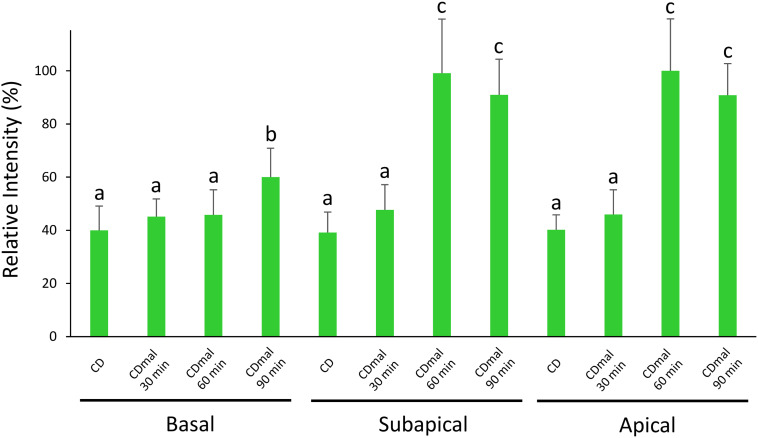
FIGURE 4.
Relative fluorescence intensity of amyB mRNAs at the apical, subapical and basal regions of cultured cells in CD before shifting and after shifting to CDmal, at 30, 60, and 90 min. Bars show mean with standard deviation. Significant difference at P < 0.05 among each lowercase (Tukey–Kramer test, n = 10).

