FIGURE 6.
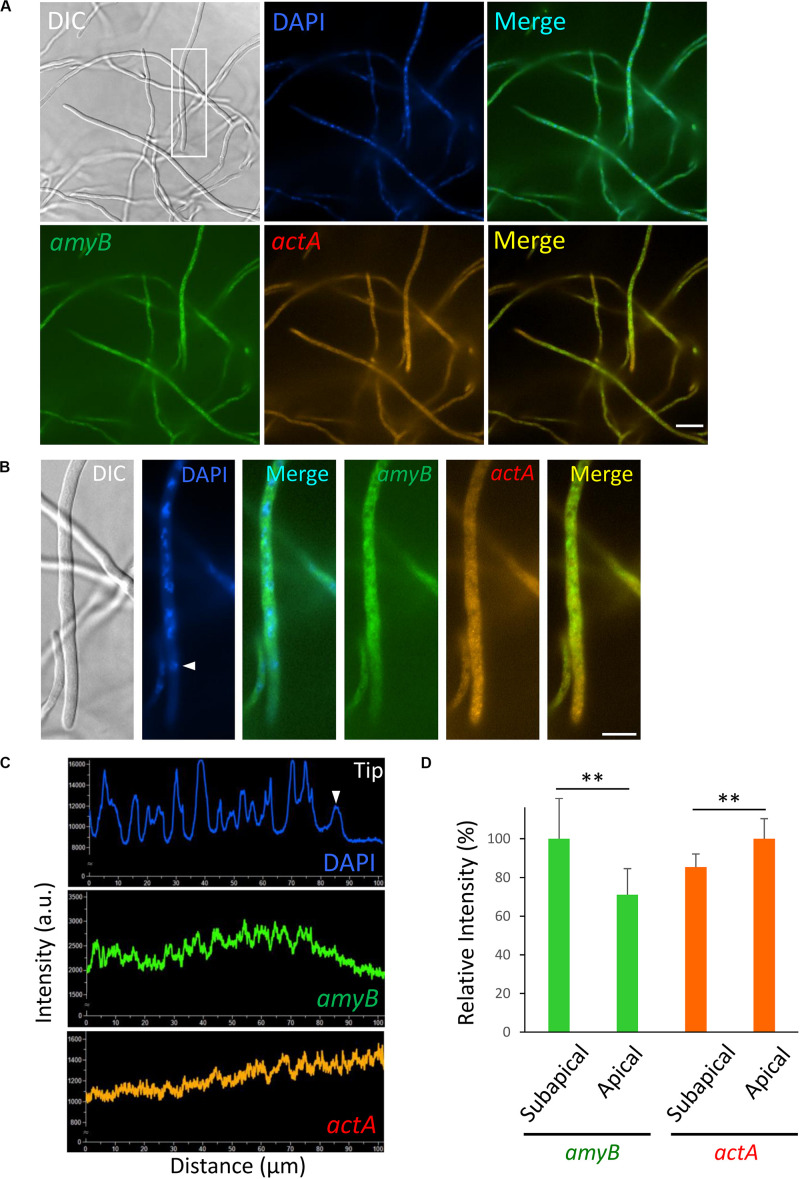
Localization of amyB and actA mRNAs in A. oryzae hyphae cultured in complete medium containing maltose. (A) smFISH was performed with amyB and actA probes added to an overnight culture in MPY. (B) Each image is a magnification of the region within the white rectangle in (A). The white arrowhead indicates the nucleus located closed to the apex. (C) Line scan analyses of DAPI, amyB and actA mRNAs fluorescent signals were conducted through the hypha of (B). The white arrowhead indicates the signal of the nucleus located closed to the apex. Note that the fluorescent signals of amyB mRNAs are not seen in the apical region, whereas those of actA mRNAs appeared more intense in the apical region. (D) Relative fluorescence intensity of amyB and actA mRNAs at apical and subapical regions. Bars show mean with standard deviation. **Statistically significant difference at P < 0.01 (Student’s t-test, n = 10). Scale bars, 20 μm (A) and 10 μm (B).

