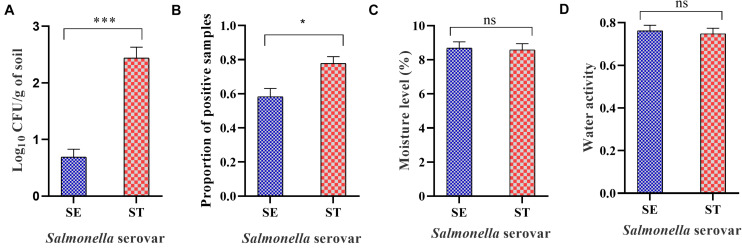
FIGURE 4.
Overall load of Salmonella Enteritidis (SE) and Salmonella Typhimurium (ST) in soil incubated at different temperatures and sampled at weekly intervals. The samples were processed through direct plating for Salmonella load determination. Samples that turned negative through the direct plating were enriched for the qualitative assessment of Salmonella. (A) Mean log10 CFU/g of SE and ST in soil over 6-week of incubation time period. (B) Mean proportion of Salmonella positive samples of SE and ST in soil incubated at different temperatures. (C) Mean moisture level of soil inoculated with SE or ST (D) Mean water activity (aw) of soil inoculated with SE or ST. Asterisks (∗∗∗) and (∗) denote significant difference at P < 0.0001 and P < 0.01, respectively, while ns denotes non-significant difference.

