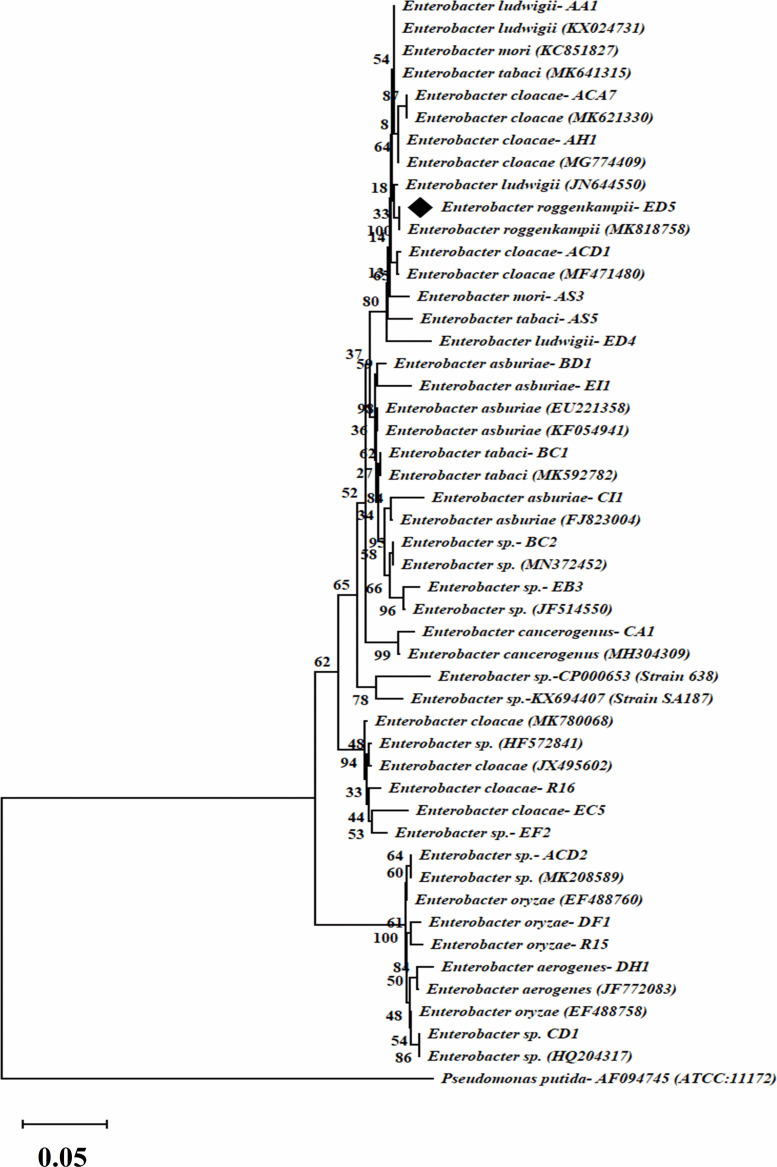
FIGURE 2.
Dendrogram of 16S rRNA gene sequences of selected twenty-three endophytic Enterobacter isolates. The evolutionary distance was calculated by the UPGMA technique. Bootstrap analysis of 1,000 replications is specified as % confidence values for specific branching. Bar indicates % similarity and P. putida, as an outgroup.

