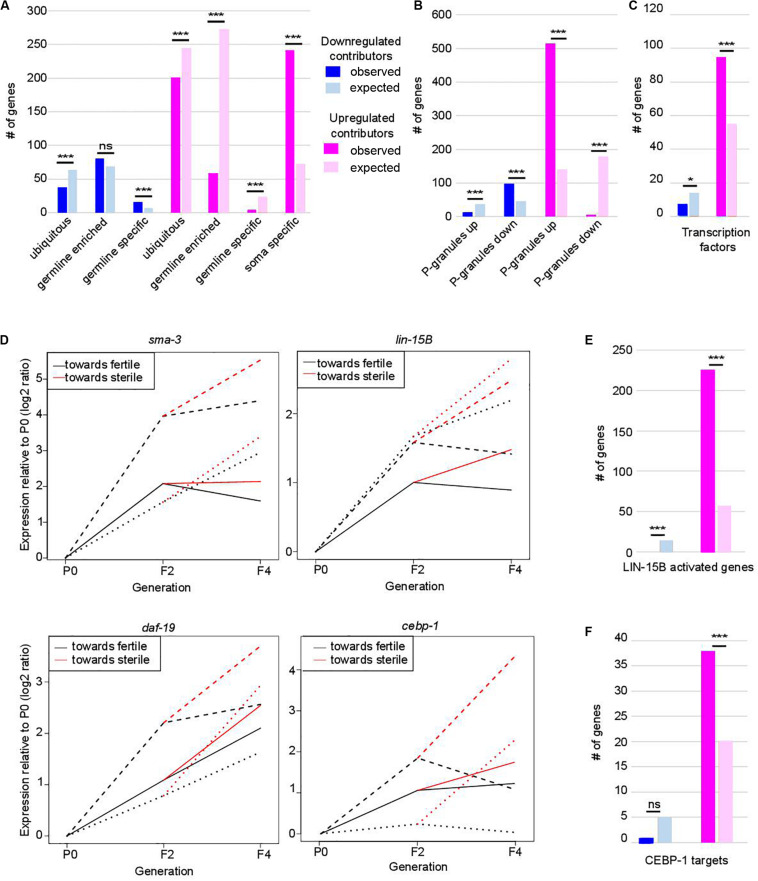
FIGURE 2.
Functional classification of contributors to set-2 dependent loss of germline identity. In (A–C,E,F) *p-value < 0.05 and ***p-value < 0.001 calculated by hypergeometric test. (A) Classification of contributors according to their expression profiles in wild-type animals. Lists of down- and upregulated contributors were compared to lists of ubiquitous, germline-enriched, germline-specific, and soma-specific genes defined in (8). Downregulated contributors are depleted for ubiquitous genes (p = 2.3e-4) and enriched for germline-specific genes (p = 2e-4); upregulated contributors are depleted for ubiquitous genes (p = 1.3e-4), germline-enriched genes (p = 2.41e-119), and germline-specific genes (p = 2.41e-119), and enriched for soma-specific genes (p = 2.96e-78). (B) Comparison of lists of contributors with genes up- or downregulated in the gonads of adult worms in which P granules had been depleted by RNAi for 2 generations [PG(–); 8]. Color code for down- and upregulated contributors is the same as in (A). Downregulated contributors are depleted for genes upregulated in PG(–) (p = 5.5e-06), and enriched in genes downregulated in PG(–) (p = 1.1e-15); upregulated contributors are depleted for genes downregulated in PG(–) (p = 1.4e-90), and enriched in genes upregulated in PG(–) (p = 1.4e-218). (C) Comparison of contributors with transcription factors (list wTF3.0). Color code for down- and upregulated contributors is the same as in (A). p = 0.03 for under-enrichment of downregulated contributors in transcription factors and p = 1.2e-8 for over-enrichment of upregulated contributors in transcription factors. (D) Relative expression to P0 of sma-3, lin-15B, daf-19, and cebp-1 transcripts in F2, fertile F4 and sterile F4. The three independent lineages analyzed are represented by distinctive line formats. For each gene, expression relative to P0 increases more when F4 animals became sterile than when they remain fertile. (E) Comparison of contributors with LIN-15B-activated genes. Color code for contributors is the same as in (A). p = 3.4e-7 for under-enrichment of downregulated contributors in LIN-15B-activated genes and p = 1.7e-93 for over-enrichment of upregulated contributors in LIN-15B-activated genes. (F) Comparison of contributors with CEBP-1 targets. Color code for contributors is the same as in (A). p = 0.2 for under-enrichment of downregulated contributors in CEBP-1 targets and p = 4.8e-5 for over-enrichment of upregulated contributors in CEBP-1 targets.

