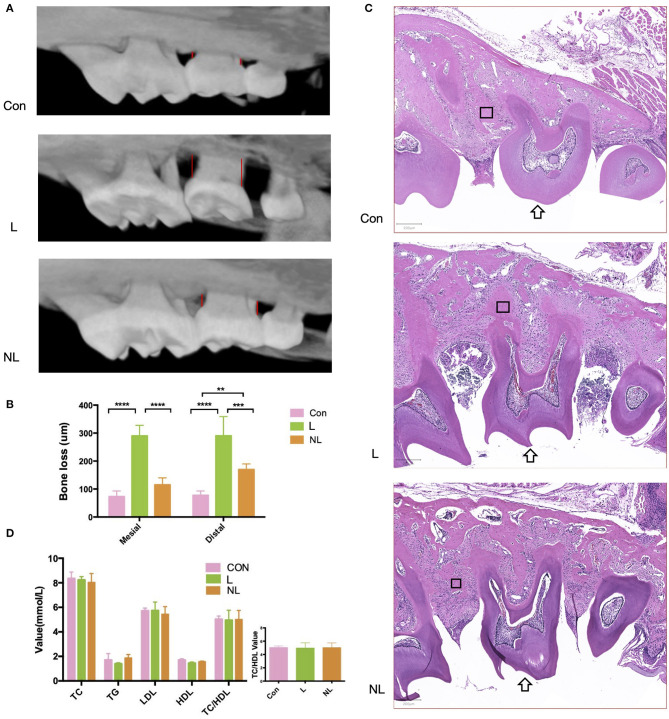
Figure 2.
Effects of ligature placement and non-surgical periodontal treatment on periodontal tissue and serum lipid profile 8 weeks after ligation. (A) Micro–CT reconstruction shows alveolar bone loss at the interproximal sites (red line) of maxillary second molars (buccal view). (B) Mesial/distal bone loss by micro CT. Values are presented as mean ± SD (n = 5–8 per group). (****P < 0.0001;***P < 0.001;**P < 0.01). (C) Hematoxylin and eosin staining of maxillary second molar(arrow). Magnification: × 50. Scale bars, 200 μm. (D)TC, TG, HDL-C, LDL-C, and TC/HDL-C levels in the plasma samples from three groups of mice (n = 5–8 per group). Con, control group; L, ligation group; NL, non-surgical periodontal treatment group; TG, total triglycerides; TC, total cholesterol; LDL-C, low-density lipoprotein cholesterol; HDL-C, high-density lipoprotein cholesterol; TC/HDL-C, total cholesterol to high-density lipoprotein cholesterol total cholesterol. The rectangle marks the alveolar bone.

