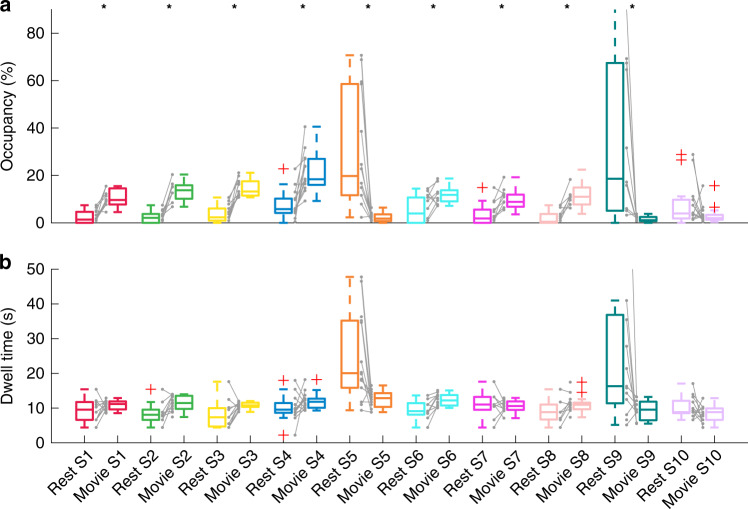
Fig. 4. Dynamic characteristics of brain states across rest and movie viewing for session A.
Session B is presented in Supplementary Fig. 3. Asterisks indicate statistical significance (paired two-sided t-tests, pFWE < 0.05; corrected for multiple comparison across 10 states; n = 14 participants examined over two consecutive sessions: rest session A and movie session A). a Fractional occupancy. States 1–4 and 6–8 have higher occupancy in movie viewing, while the opposite is true for states 5 and 9. The exact p values for states S1–S10 are: 1.8e−7; 7.0e−7; 1.6e−4; 8.7e−4; 3.7e−3; 7.2e−5; 4.7e−5; 3.3e−3; 0.13. b State dwell times. Qualitatively, the dwell time for states 5 and 9 are higher in rest condition. Grey lines show how occupancy and dwell times are paired within participants. Boxplots: upper (lower) box edge: 25th (75th) percentile; central line: median; dotted lines: 1.5× interquartile length; whiskers extend to the most extreme data points not considered outliers; red plus: outliers.

