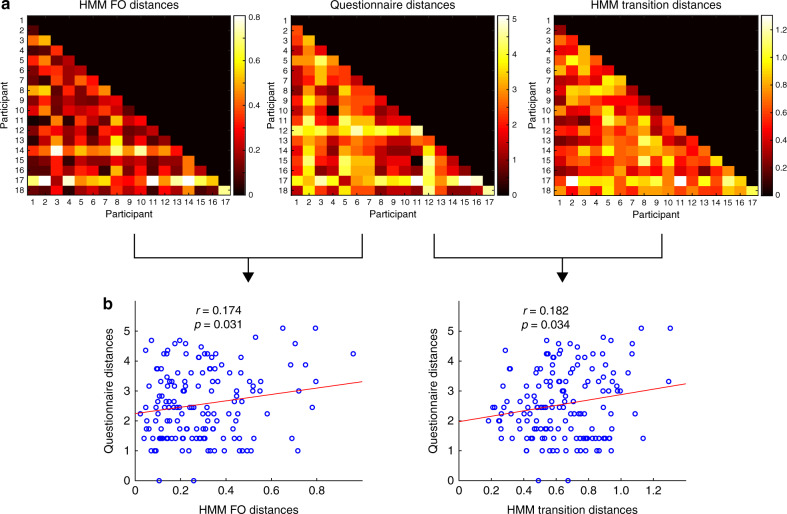
Fig. 7. Association between brain state dynamics and behaviour.
a Representations across the participant sample of fractional occupancy (FO), questionnaire responses, and state transition matrices. These are given by the inter-subject distance matrix, where each element is a pair-wise distance. Correlation distance is used for FO and state transitions, whereas the Euclidean distance was used for questionnaire distances. b Pearson’s correlation between the representations of questionnaire answers and FO (left) and state transitions (right).

