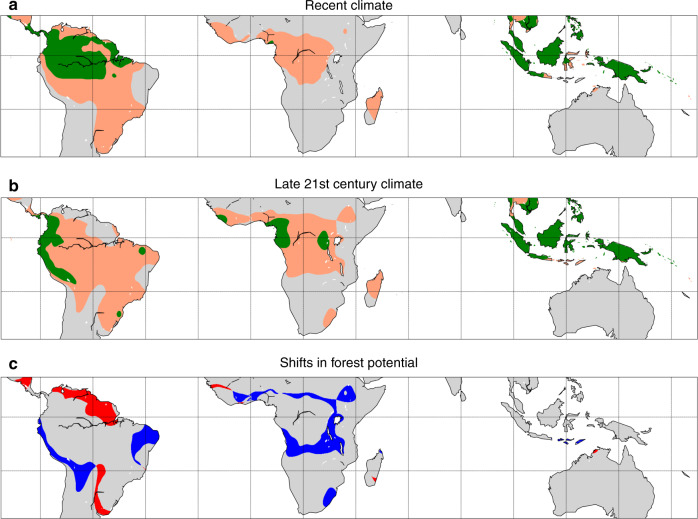
Fig. 2. Changing hysteresis of forest cover in the tropics during the 21st century.
a Minimal (green) and maximal (beige) forest distributions under recent climate (2003−2014). b Minimal (green) and maximal (beige) forest distributions under the late 21st century climate (2071−2100). c Shifts in forest potential between the recent and late 21st century climates. Red areas are stable forest under the recent climate, but cross the tipping point into the nonforested rainfall range under the late 21st century climate; blue areas are too dry for forest under the recent climate, but cross the tipping point to the stable forest–rainfall range under the late 21st century climate. Note that these estimates are conservative in the sense that a rainfall change from the stable to the bistable range is assumed to have no effect on forest extent. For associated changes in rainfall, see Supplementary Figs. 6 and 7.

