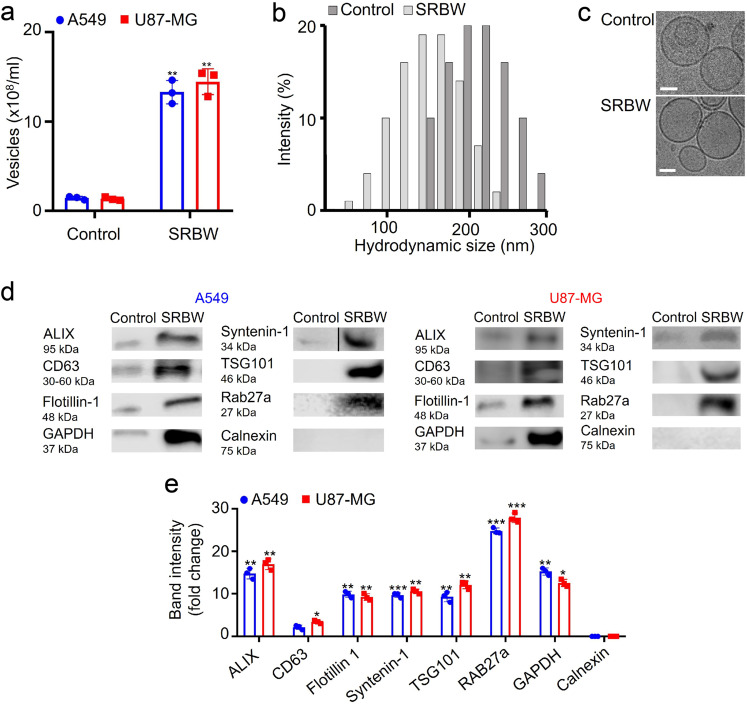
Fig. 2. Exosome characterisation.
Comparison of a the number concentration, obtained through NTA, b the hydrodynamic size distribution, obtained through DLS, c representative cryo-EM images, d the protein profile, obtained via western blotting, and e the band intensities of EVs isolated from the unexposed control (dark grey bars in b) and SRBW-treated (light grey bars in b) U87-MG cells (aside from a, e where blue circles indicate EVs isolated from A549 cells and red squares indicate EVs from U87-MG cells) after 7 successive excitation–incubation cycles; the scale bars in c represent a length of 50 nm. The data are represented in terms of the mean value ± the standard error over triplicate runs, and the asterisks *, ** and *** indicate statistically significant differences with p < 0.05, p < 0.01 and p < 0.001, respectively. We note that the blot image for syntenin-1 has been spliced, as demarcated with a dividing line; a full scan of the entire blot is provided in Supplementary Fig. 5.

