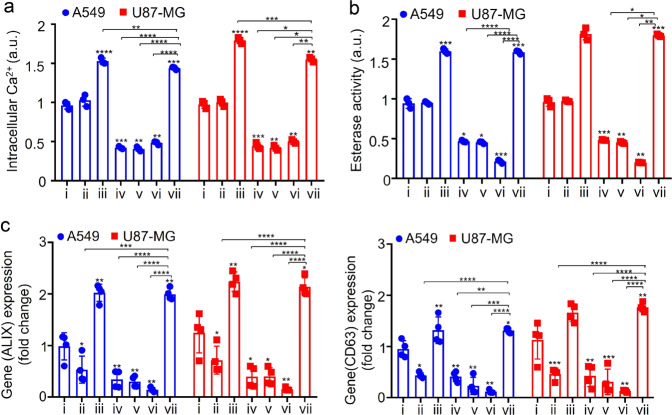
Fig. 4. Intracellular calcium profiling.
a Intracellular Ca2+ levels, measured from a Fura-2 AM assay, b acetylcholine esterase activity and, c mRNA expression of ALIX and CD63, as quantified via RT-qPCR analysis, for A549 (blue circles) and U87-MG (red squares) cells exposed to the SRBW irradiation compared to the unexposed control (i), in the absence (−) and presence (+) of extracellular calcium as well as a combination of a Ca2+ inhibitor (thapsigargin), ion channel blocker (amiloride HCl) and membrane-permeable intracellular Ca2+ chelator (BAPTA-AM); see the key in Table 1. The data are represented in terms of the mean value ± the standard error over quadruplicate runs, and the asterisks *, **, *** and **** indicate statistically significant differences with p < 0.05, p < 0.01, p < 0.001 and p < 0.0001, respectively.

