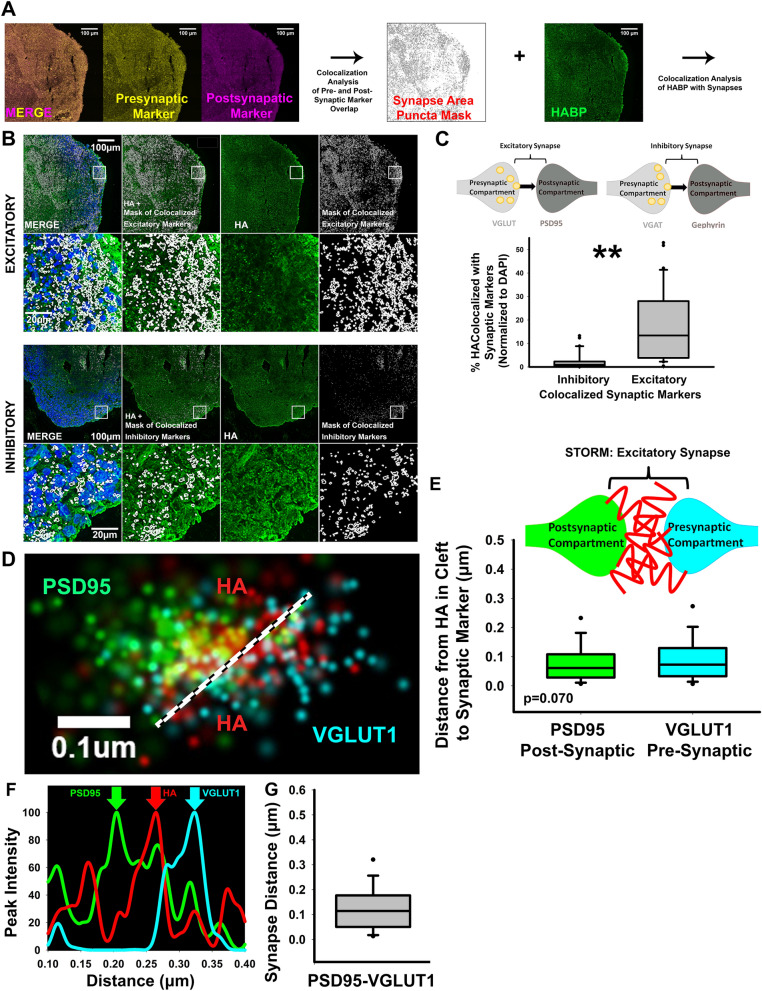
Figure 2.
HA is present at excitatory synapses. (A) Representative workflow of analysis of HA localization at excitatory and inhibitory synapses. Confocal images of pre- and post-synaptic markers are first analyzed to identify co-localization in synapses. The identified synapses are then analyzed for colocalization with HA. (B) Representative images of DAPI (blue), and HA (green) together with excitatory synapse markers, vGlut-1 and PSD-95, and inhibitory synapse markers, vGAT and gephyrin. White outlines indicate the identified synapses. (C) Co-localization analysis reveals that HA is preferentially enriched at excitatory synapses, shown as %HABP colocalized with synaptic markers. The corresponding percentage of excitatory and inhibitory synapses containing HA is quantified in Fig. S4, further demonstrating that excitatory synapses preferentially associate with HA. (D) STORM imaging was used to visualize HA at individual excitatory synapses. The pre-synaptic marker vGlut-1 is shown in blue, HA is shown in red, and post-synaptic PSD-95 is shown in green. Note that HA is positioned between the pre- and post-synaptic compartment of the excitatory synapse. (E) Quantification of the distance between HA and pre-synaptic vGlut-1 and post-synaptic PSD-95 as determined by the displacement of maximum peak intensities. There is not a significant difference between the distance of HA-vGlut1 and HA-PSD-95, indicating that HA does not preferentially localize to one side of the excitatory synapse, and instead lies in the synaptic cleft between pre- and post-synaptic compartments as illustrated by the corresponding diagram. n = 167 synapses. (F) Representative plot profile of the excitatory synaptic markers and HA in the highlighted synapse (D). (G) Quantification of distance from pre-synaptic vGlut-1 to post-synaptic PSD-95, n = 167 synapses.

