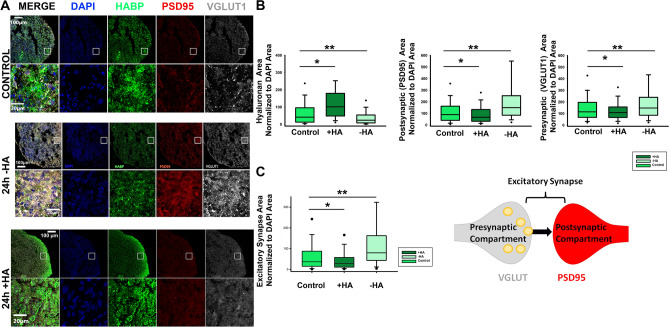
Figure 4.
HA regulates excitatory synapse formation. (A) 10 μm-thick cryosections of 90-day-old cortical spheroids were stained for excitatory synapse markers after 24 h of treatment with purified HA (+ HA) or streptomyces hyaluronidase (− HA). Blue: DAPI, Green: HABP (HA), Red: PSD-95 (post-synaptic marker), Grey: vGlut-1 (pre-synaptic marker). Scale bars for top panels of spheroid images are 100 µm, scale bars for bottom ROI panels for spheroid images are 20 µm. (B) Graphs quantifying the area of individual synapse markers following hyaluronan manipulations. n = 30 spheroid slices per treatment. (C) Quantification of the resulting changes in total excitatory synapse area as determined by co-localization of pre- and post-synaptic markers normalized to DAPI. n = 30 spheroid slices per treatment. Solid black dots represent 95th percentile outliers, one asterisk signifies p value < 0.05, two asterisks signify p value < 0.01.

