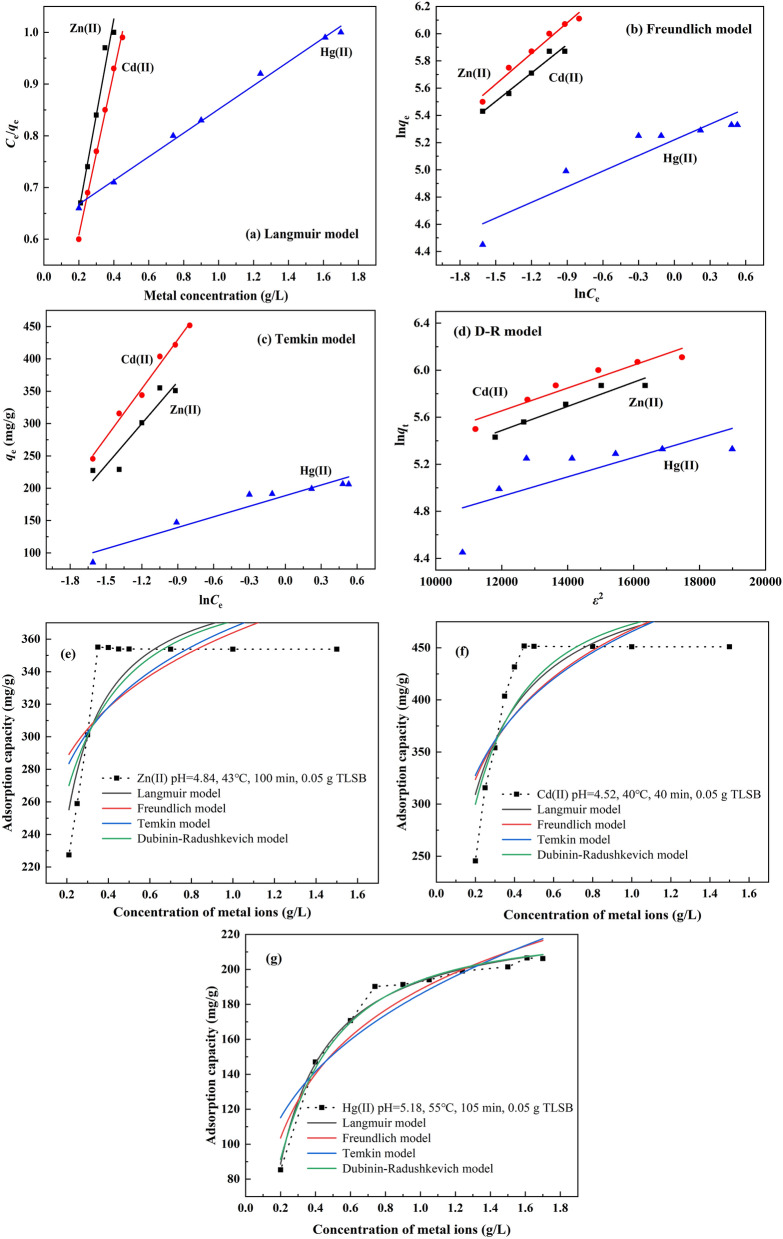
Figure 5.
Linear fitting curves of adsorption isotherm models to the experimental data. (a) Langmuir, (b) Freundlich, (c) Temkin, and (d) D–R models. Nonlinear fitting curves for the adsorption isotherms of (e) Zn(II) at pH 4.84, 43 °C, 100 min, 0.05 g TLSB, (f) Cd(II) at pH 4.52, 40 °C, 40 min, 0.05 g TLSB, and (g) Hg(II) at pH 5.18, 55 °C, 105 min, 0.05 g TLSB.

