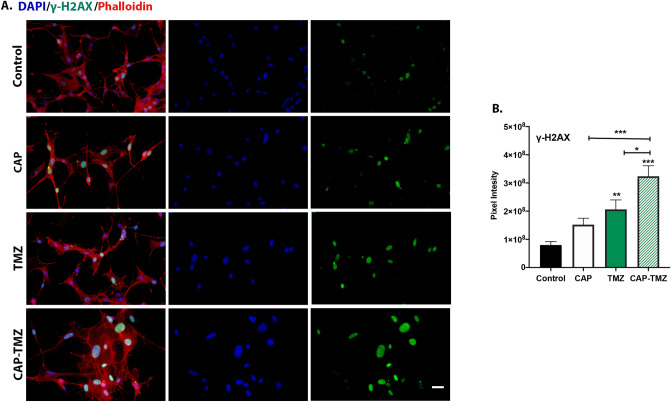
Figure 4.
Influence of CAP on TMZ induced DNA damage. (A) The immunofluorescence images of glioblastoma U87MG cells antibodies against γ-H2AX for the following variables: untreated control, 180 s CAP (1 treatment), 50 μM TMZ (3 treatments) and combined CAP–TMZ treatments on day 6. (B) The data represents the level of phosphorylated H2AX in each treatment group and is expressed as the mean pixel intensity per cell. These values are calculated by dividing the sum intensity of each image by the total number of cells in the image. A total of 24 fields were analyzed per condition. Error bars indicate the standard error of mean, and the asterisk indicates statistical significance to untreated control conditions unless otherwise noted. Scale bar: 14 μm.

