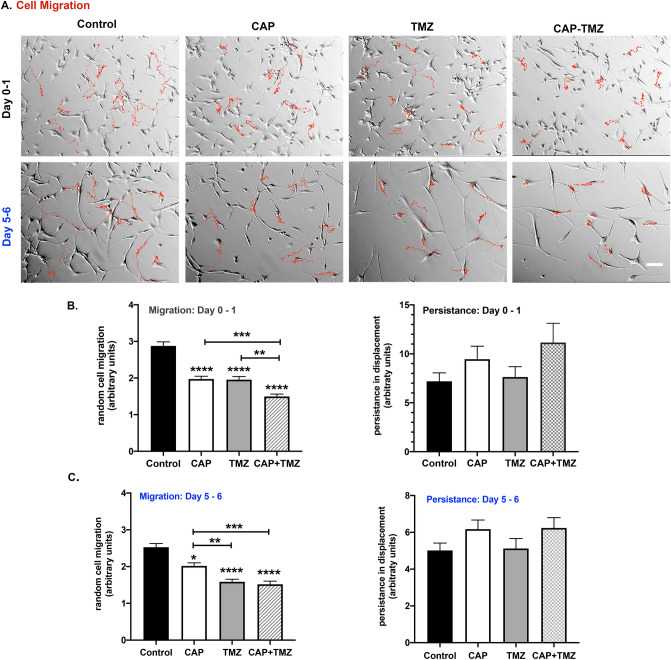
Figure 5.
CAP reduces the rate of cell migration in U87MG cells. (A) Control (untreated), CAP-only (180 s), TMZ-only (50 μM) and combined CAP–TMZ treated cells were tracked using a time-lapse microscopy. Tracks of ten representative cells studied over the 16-h time period are indicated in red for Day 0–1 and Day 5–6. Images were obtained every 10 min until 100 images were acquired (16 h, 40 min). The tracks traveled by cells in the CAP–TMZ condition are shorter than those for the control variables (B and C). The graphs indicate the rate of cell velocity and cell displacement of 60 cells per variable. Persistence was measured as the ratio between net and total displacements. Error bars indicate the standard error of the mean, and the asterisk indicates statistical significance to untreated control conditions unless otherwise noted. Scale bar: 14 μm.

