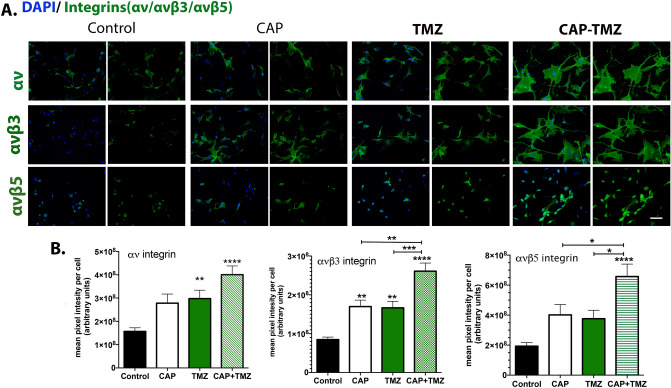
Figure 6.
Cell surface integrin expression levels of total αv, αvβ3 and αvβ5. (A) The immunofluorescence images of glioblastoma U87MG cells are shown for the following variables: untreated control, 180 s CAP (1 treatment), 50 μM TMZ (3 treatments) and combined CAP–TMZ treatments on day 6. Images of cells expressing total αv, αvβ3 and αvβ5 integrins are shown in green and the nuclei in blue. (B) The data represents the level of integrin in each treatment group and is expressed as the mean pixel intensity per cell. These values are calculated by dividing the sum intensity of each field by the total number of cells in the field. A total of 12 fields were obtained and analyzed per condition. Error bars indicate the standard error of mean, and the asterisk indicates statistical significance to untreated control conditions unless otherwise noted. Combined CAP–TMZ treated cells express more αv, αvβ3 and αvβ5 integrins than control, CAP or TMZ treated cells. Error bars indicate the standard error of the mean, and the asterisk indicates statistical significance to untreated control conditions unless otherwise noted. Scale bar: 50 μm.

