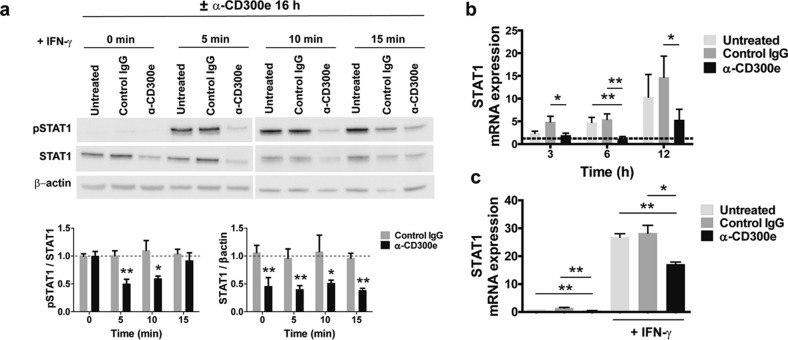
Figure 6.
Activation through CD300e impairs STAT1 expression. (a) STAT1 and pSTAT1 cell content in monocytes activated or not by anti-CD300e for 16 and then stimulated with 10 ng/ml IFN-γ for 5, 10 or 15 min. Blot refers to a representative of 4 independent experiments. Quantification was performed by densitometry. Data referred to pSTAT1 are expressed as ratio on STAT1; data referred to STAT1 are expressed as ratio of STAT1/β-actin (mean ± SEM). Expression levels of treated cells are relative to values of untreated cells set as 1 (dotted line) for each time point. Significance was determined by Student’s t-test vs untreated cells *p ≤ 0.05; **p ≤ 0.01. (b) mRNA expression of STAT1 in monocytes activated or non-activated by anti-CD300e. At the indicated time points, cells were processed for mRNA extraction. mRNA expression was determined by qRT-PCR. Data were normalized to β-actin. Expression levels of treated cells are relative to values of T0 cells set as 1 (dotted line). Data are shown as mean ± SEM of 4 independent experiment. (c) mRNA expression of STAT1 in monocytes activated or not by anti-CD300e for 6 h and then stimulated or not for further 6 h with 10 ng/ml IFN-γ. Cells were processed for mRNA extraction. mRNA expression was determined by qRT-PCR and data were normalized to β-actin. Expression levels of treated cells are relative to untreated cells set as 1. Data are shown as mean ± SEM of 4 independent experiments. Significance was determined by Student’s t-test. *p ≤ 0.05; **p ≤ 0.01.

