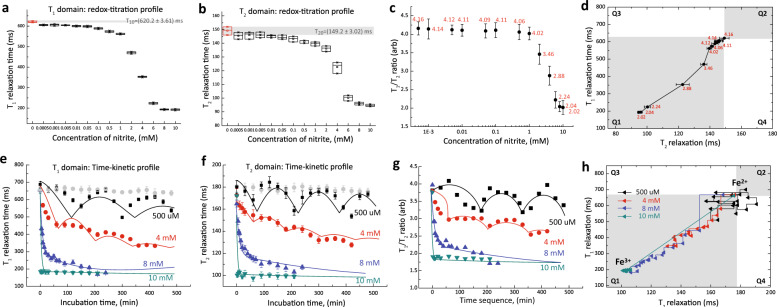
Fig. 2. Nitrite-induced ferrous oxidation.
Redox-titration profile of red blood cells as function of nitrite concentration in a T1 relaxation and b T2 relaxation domain. The incubation times were 10 min. The control baseline readings were (T2o = 149.5, T1o = 621.3) ms, which is the readings for oxy-Hb without any nitrite exposure. The limit of detection (LOD) is about 0.0005 mM of nitrite concentration (gray bar). The data is represented by box-plot format. The corresponding concentration-dependent c A-ratio, and d T1–T2 trajectories of the gradual inversion of Fe2+ subpopulation to complete formation of Fe3+ population. Time-dependent kinetic profile of ferrous oxidation using nitrite concentrations (500 μM, 4 mM, 8 mM, and 10 mM) in e T1 relaxation and f T2 relaxation domain. The corresponding g A-ratio, and h T1–T2 trajectories in the magnetic state diagram. Three different samplings were taken from the same donor, and the results were reported as mean ± standard error measurement. For curve fitting, a general function of exp(−Ct)|cos(Ct)| can be used to describe the oscillatory behavior, where C is concentration.

