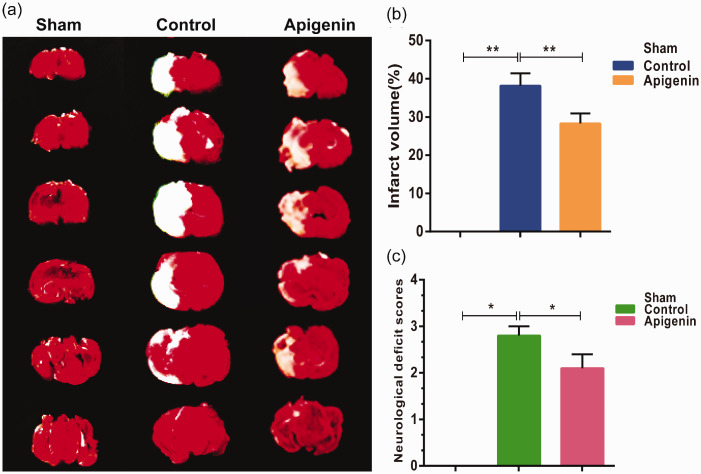
Figure 6.
Effects of apigenin on infarct volume and neurological functional outcome in rats (n = 6). (a) The white areas indicate infarcted brain tissue (TTC staining). (b) The percentages of cerebral infarction volume were calculated as described in the materials and methods section. (c) Neurological deficit scores. *P < 0.05; **P < 0.01.

