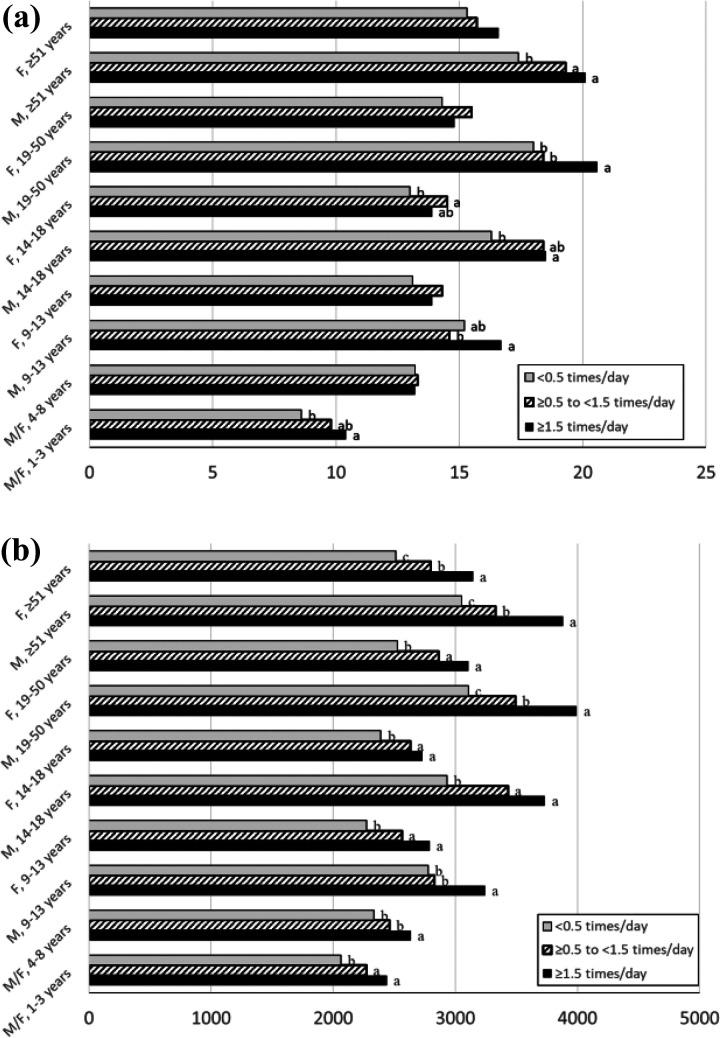
Figure 1.
Fiber (a) and potassium (b) intake among Canadians categorized by reported frequency of fruit juice consumption, CCHS, Cycle 2.2 (Mean values of intake). Fruit juice assumed to be 100% juice; usual mean intakes were estimated using PC-SIDE (Department of Statistics, Iowa State University) with balanced repeated replication methods and ratio adjustment for intake day, categorized as weekend/weekday, and energy intake.
a, b, c Bars within an age–sex group with unlike superscript letters are significantly different (p<0.05; Bonferroni-adjusted p<0.0167).
Sample sizes by frequency category (<0.5, ≥0.5 to <1.5, or ≥1.5 times/day) in each age–sex group: M/F, 1–3 years (447, 740, 1006); M/F, 4–8 years (707, 1361, 1273); M, 9–13 years (566, 840, 743); F, 9–13 years (550, 867, 626); M, 14–18 years (752, 946, 697); F, 14–18 years (803, 948, 594); M, 19–50 years (2347, 1655, 640); F, 19–50 years (2618, 1641, 505); M, ≥51 years (2181, 1733, 409); F, ≥51 years (2861, 2754, 541).

