. 2020 Sep 14;9:e57067. doi: 10.7554/eLife.57067

Figure 4. Monitoring the effect of policy interventions for selected groups of universities.

(A) The annual change in percentage (rolling current year percentage minus the previous year percentage) of gold OA for six UK universities. The top three universities are those with the largest additional funding compared to the bottom three universities which received less additional funding. (B) The annual percentage of green OA through the home institutional repositories of four UK universities compared to high performing universities from elsewhere. (C) The annual percentages of hybrid OA at five universities in the Netherlands. (D) Three pairs of UK and US universities, selected based on having a similar size and level of green OA. The annual percentages of total green OA are depicted for each university. Additional figures are provided in Figure 4—figure supplement 1.

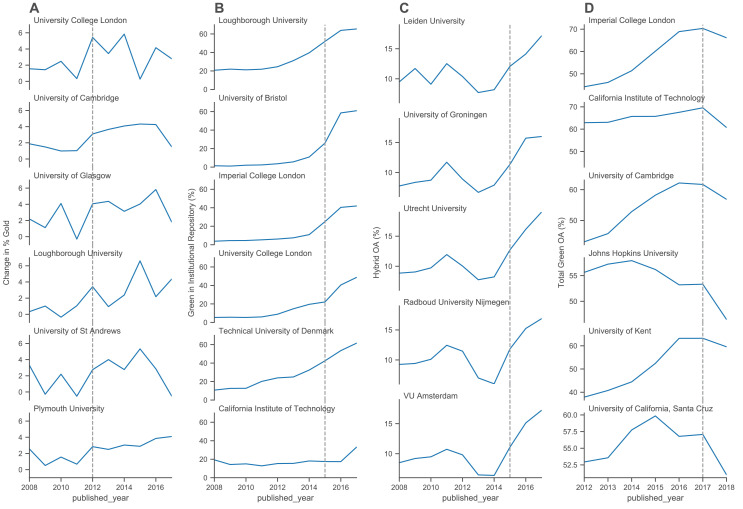
Figure 4.

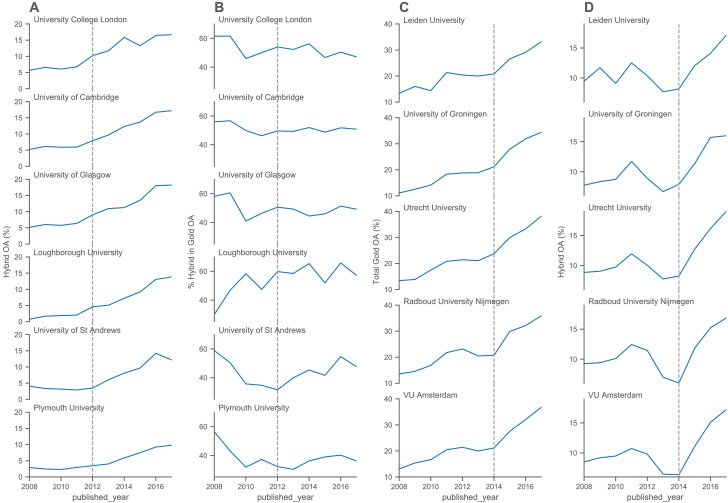
Figure 4—figure supplement 1. Monitoring changes in the percentage of OA publications for selected groups of universities from the UK and the Netherlands.

Figure 4—figure supplement 1.

(A) The annual percentages of Hybrid OA publications for six UK universities. The top three are those that received the largest additional funding to support open access publishing compared to the bottom three that received less additional funding. (B) For the same set of UK universities, this panel shows the proportion of Hybrid OA publications within Total Gold OA publications. (C) The annual percentages of Total Gold OA for five Dutch universities, showing steady increase in Total Gold OA. (D) The annual percentages of Hybrid OA for the same five Dutch universities, showing a sharp increase in Hybrid OA around 2014 and 2015.