
Figure 4.
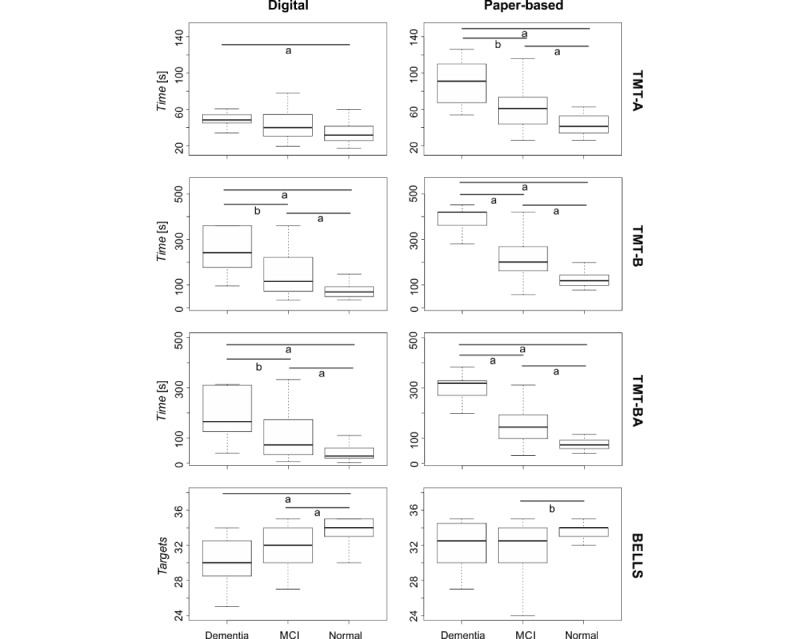
Differences in test scores based on the participant’s neuropsychological diagnosis. The boxplots represent, for the 3 neuropsychological diagnosis groups (normal, mild cognitive impairment, and dementia), the main outcome of the tests (time for Trail Making Test [TMT]-Part A, TMT-B, and TMT-BA and targets for Bells Test) as median and IQRs. Asterisks indicate significance from pairwise comparison (a indicates 1% significance and b indicates 5% significance ).