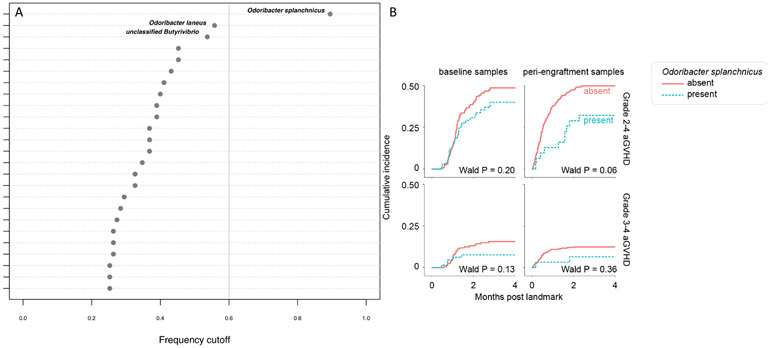
Figure 1. Association between rs4415345, gut microbiota, and acute GVHD.

Stability selection analyses for the G allele of rs4415345. We chose the lower bound (0.6, represented by the vertical gray line) of the frequency cutoff recommended by the authors of the stabs R package. Each taxon is represented by a circle. Numbers along the x-axis show the frequency at which taxa were predictive in simulations across the 100 subsamples. The names of the top three taxa are shown. (B) Presence of O. splanchnicus in baseline and peri-engraftment fecal samples and the risk of aGVHD. The horizontal axis indicates months post the landmark. For the analysis of baseline samples (earliest sample collected per patient between day −30 and −6), the landmark was HCT day 0 (when cells were infused). Among 226 patients with evaluable baseline samples, O. splanchnicus was present in 65 and absent in 161 patients. For the analysis of peri-engraftment samples (median abundance in all samples collected per patient during days 7–21), the landmark was HCT day 21. Among 432 patients with evaluable peri-engraftment samples who had not been diagnosed with grade II-IV aGVHD as of the landmark, O. splanchnicus was present in 31 and absent in 401 patients. Among the 450 patients with evaluable peri-engraftment samples who had not been diagnosed with grade III-IV aGVHD as of the landmark, O. splanchnicus was present in 31 and absent in 419 patients.
