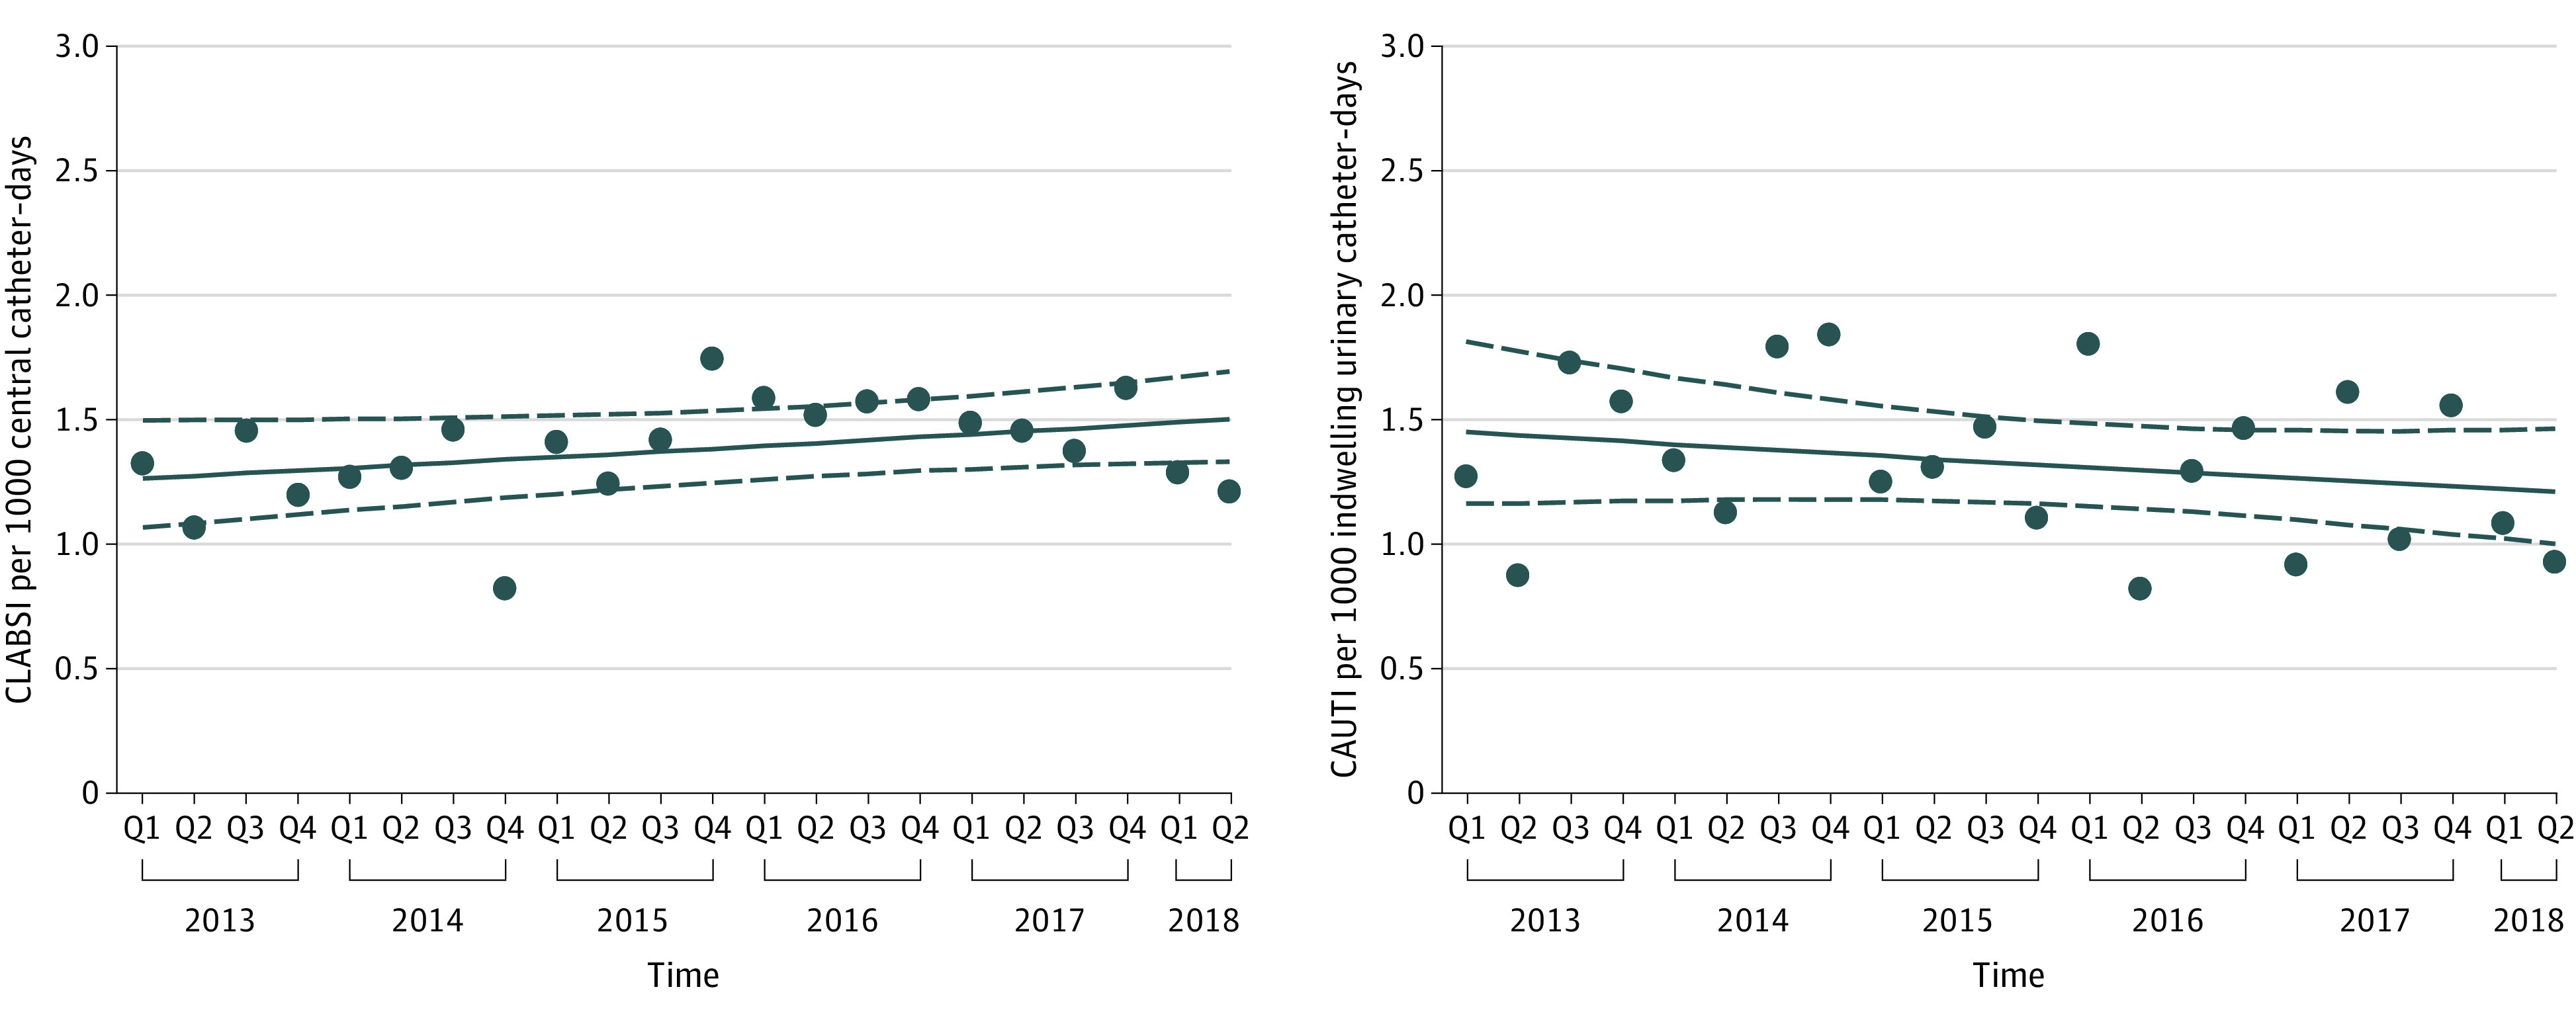
Figure 2. Observed Device-Associated Central Catheter–Associated Bloodstream Infection (CLABSI) and Catheter-Associated Urinary Tract Infection (CAUTI) Rates Over Time Among Hospitalized Children.

Each series depicts observed quarterly device-associated infection rates aggregated for all study hospitals for CLABSI (A) and CAUTI (B). Solid lines indicate estimated trend lines and dashed lines represent the corresponding upper and lower limit of the 95% CIs of the estimated trend lines. Q indicates quarter.
