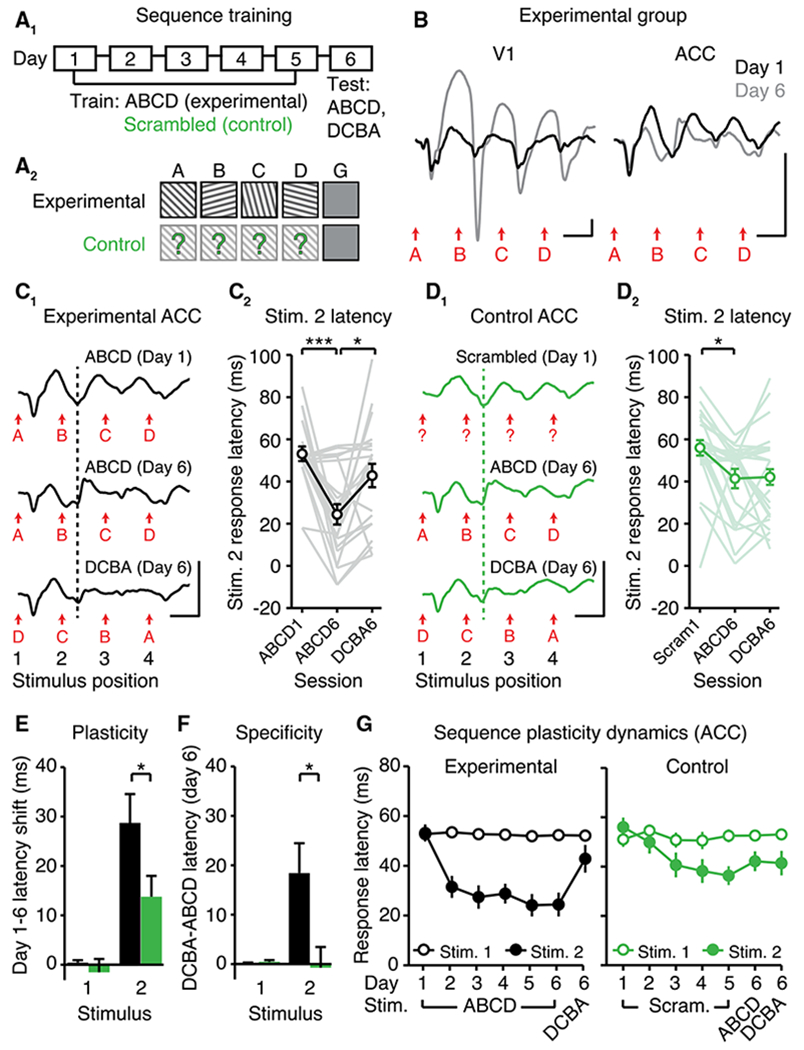
Figure 3. Patterned Visual Experience Drives Sequence-Specific Plasticity in ACC.

(A1) Sequence training over six days using either (A2) familiar (experimental, n = 21) or pseudorandomized sequences (control, n = 24).
(B) VEPs illustrate experience-dependent plasticity in VEP magnitude in V1 (left) and in VEP latency in ACC (right).
(C) Experience-dependent plasticity in the latency to stimulus 2 (B position) in experimental mice (black). (C1) VEPs. (C2) Quantification.
(D1 and D2) In control mice (green), residual sequence plasticity was non-specific. Dotted lines are aligned to the peak negativity driven by the second stimulus (“B” or random) on day 1.
(E) “Plasticity” refers to the within-animal latency shift between days 1 and 6 in experimental (black) and control (green) mice.
(F) “Specificity” refers to the within-animal difference in response latency (ABCD versus DCBA) on day 6.
(G) Response latencies to stimuli 1 (A position) and 2 (B position) across training.
All traces represent group average VEPs. Scale bars: 50 μV, 100 ms. *p < 0.05; **p < 0.01; ***p < 0.0001. Error bars represent SEM.
See also Figure S3.
