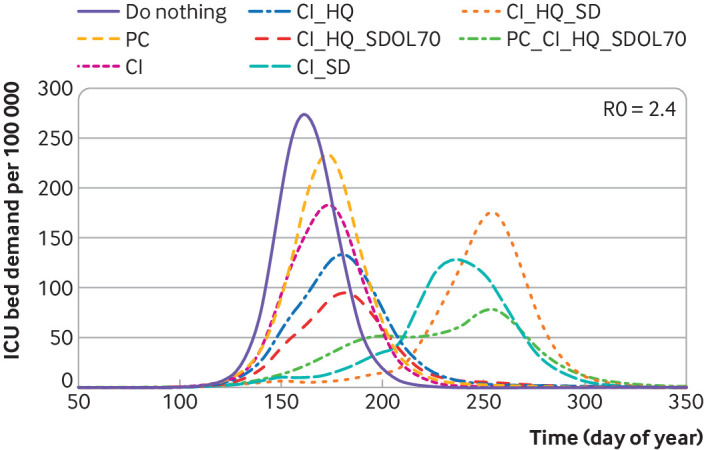
Fig 1.

Flattening the curve. The first five curves are the same scenarios as presented in figure 2 of report 9. Three additional scenarios are also shown (summarised in table 1 and table 3). The scenario of place closures, case isolation, household quarantine, and social distancing of over 70s would minimise peak demand for intensive care but prolong the epidemic, resulting in more people needing intensive care and more deaths. These findings illustrate why adding place closures to a scenario with case isolation, household quarantine, and social distancing of over 70s can lead to more deaths than the equivalent scenario without place closures. Doing so suppresses the infection when the interventions are present but leads to a second wave when interventions are lifted. In the model this happened in July 2020, after a 91 day lockdown: in practice the first lockdown was extended into August, so the second wave was postponed to September. The total number of deaths in the scenario of case isolation, household quarantine, and social distancing of over 70s is 260 000, whereas when place closures are included the total number is 350 000. Similarly, comparing general social distancing with equivalent scenarios without social distancing, the second wave peak in the case isolation, household quarantine, and general social distancing scenario is higher than the first wave peak in the case isolation and household quarantine scenario. ICU=intensive care unit; PC=place closures; CI=case isolation; HQ=household quarantine; SDOL70=social distancing of over 70s; SD=general social distancing
