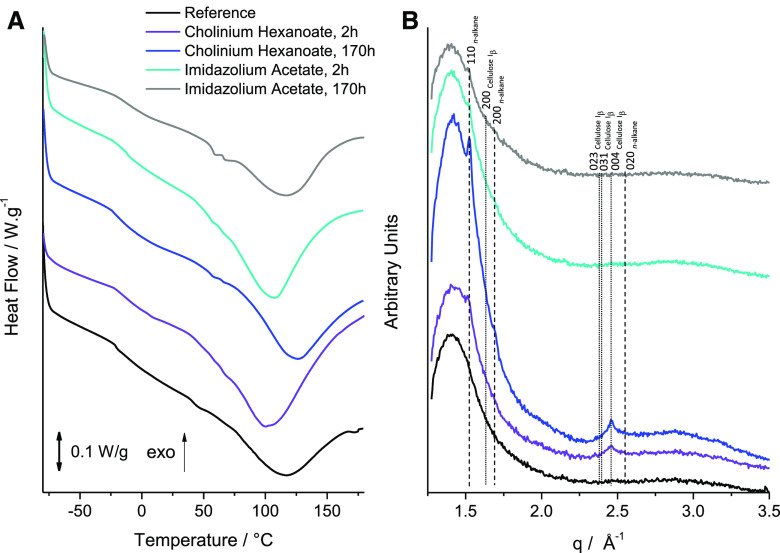
Figure 4.
Analysis of the crystallinity properties of the cutin-enriched materials upon extraction. DSC thermograms (A) and WAXS patterns (B) collected for a reference enzymatically extracted cutin material (black curve) and cutin materials extracted from tomato peels using ionic liquids for various durations of treatment: cholinium hexanoate for 2 and 170 h (purple and blue curves, respectively) and imidazolium acetate for 2 and 170 h (gray and cyan curves, respectively). The vertical straight lines in WAXS patterns indicate the positions of diffraction peaks of cellulose (dotted lines) and crystallized n-alkane chains (dashed lines). Miller indexes assigned to the lines correspond to cellulose Iβ (monoclinic space group P1211) and n-alkane chain packing (orthorhombic space group Pnma).

