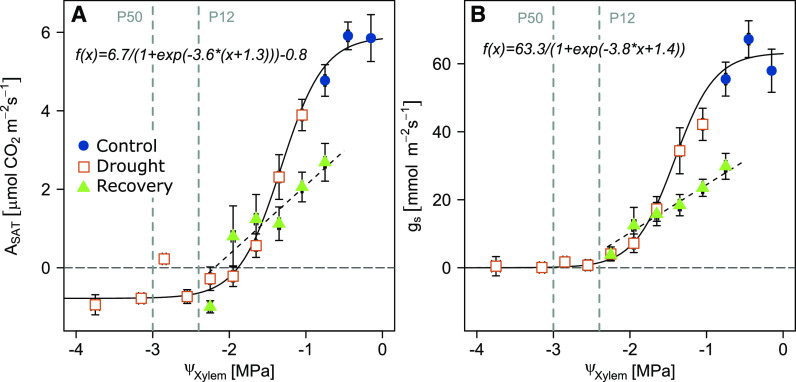
Figure 5.
Relationships of leaf gas exchange with ΨXylem. Dependencies of ASAT (A) and gS (B) with ΨXylem are given for the control treatment (including prestress data of the drought treatment; blue circles), drought progression (orange squares), and recovery (green triangles). Data are bin averages for intervals of 0.3 MPa, and means ± se are shown. P12 and P50 as determined by Cavitron measurements are indicated. A sigmoidal function was fitted to control and drought data (ASAT root-mean-square error = 1.64; gs root-mean-square error = 20.9) and a linear regression to data of drought seedlings after rewatering (ASAT R2 = 0.08; gs R2 = 0.09).

