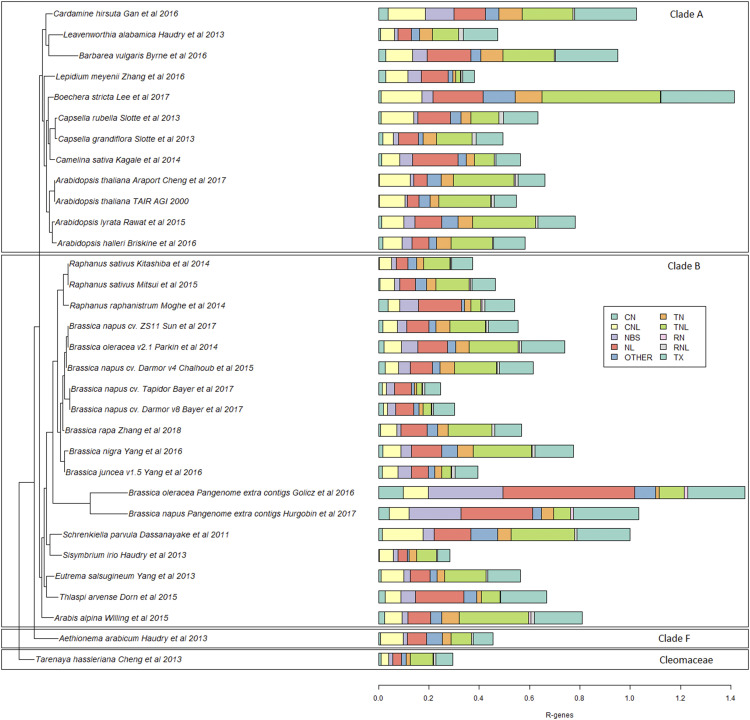
Figure 2.
Phylogeny of Brassicaceae genomes based on R genes. The colored bars show the percentage of NLRs in each genome. Genes were identified using RGAugury. Boxes show the agreement of the presented results with the previously reported phylogenetic relationship of Brassicaceae by Huang et al. (2016). All species from clade A grouped and formed a separate clade, similar to species from clade B and F. Species from the Cleomaceae family formed a separate clade from all Brassicaceae family species.

