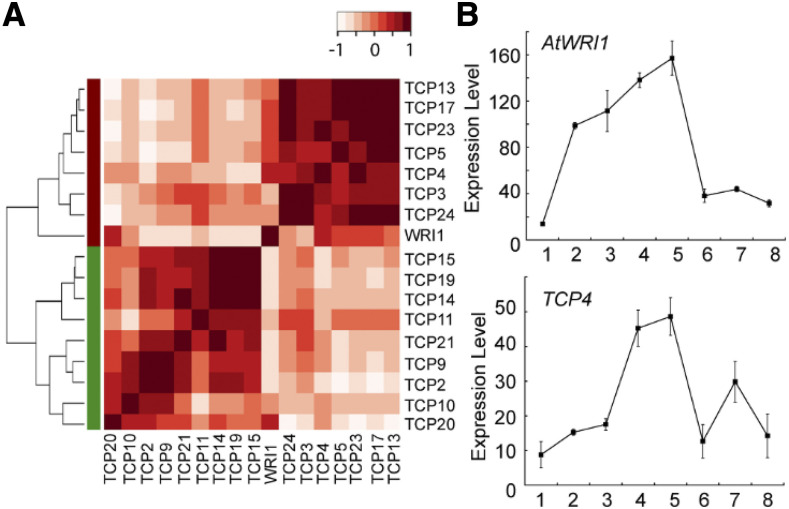
Figure 2.
In silico analysis of AtWRI1 and TCP expression. A, Coexpression of AtWRI1 with TCPs in Arabidopsis embryo tissues. Hierarchical clustering and heat map shows that AtWRI1 strongly correlates with and clusters with TCP4. B, Expression profiles of AtWRI1 and TCP4 during various stages of embryo development. Expression data are taken from the Arabidopsis eFP browser. Points on the graphs are as follows: (1) seed stage 3 with siliques; (2) seed stage 4 with siliques; (3) seed stage 5 with siliques; (4) seed stage 6 without siliques; (5) seed stage 7 without siliques; (6) seed stage 8 without siliques; (7) seed stage 9 without siliques; and (8) seed stage 10 without siliques. Results are shown as means ± sd (n = 3). Experimental details were described for the eFP browser (Winter et al., 2007).

