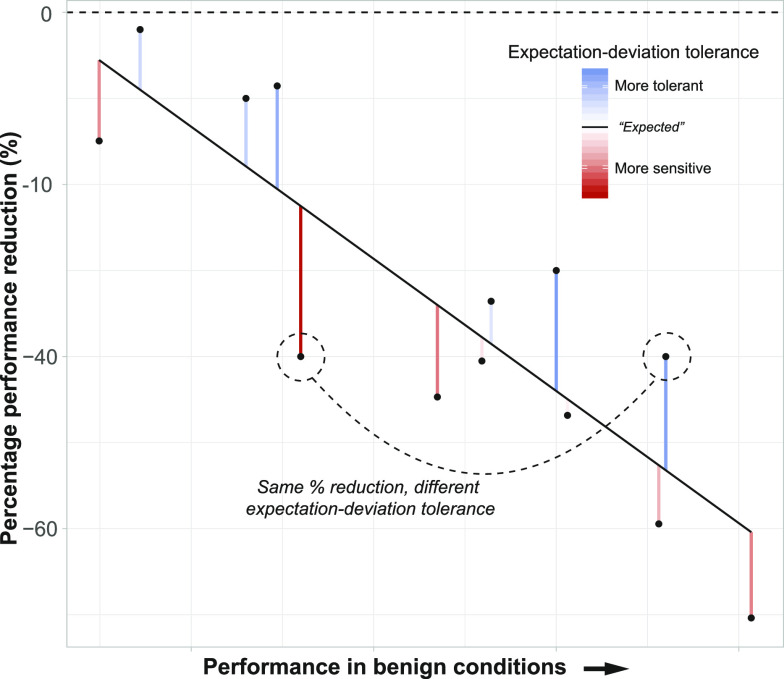
Figure 1.
Conceptual diagram of expectation-deviation tolerance. Given a negative relationship between performance (estimated using any relevant measure) and the proportional effect of stress, along with variation in both, it can be difficult to define tolerance versus sensitivity. Two different genotypes (highlighted with dashed circles/line) could have the same percentage reduction in performance due to stress while differing greatly when compared to their expected performance reduction when accounting for inherent differences in performance under benign conditions (red/blue shading). The magnitude of this deviation (red/blue lines) from the best-fit line (solid line) provides an estimate of tolerance/sensitivity that is independent of differences in performance under benign conditions. Residuals from this best-fit line thus reflect genotypes that are more sensitive (below the line, highlighted red) or tolerant than expected (above the line, highlighted blue; see the introduction for more details).

