Figure 4.
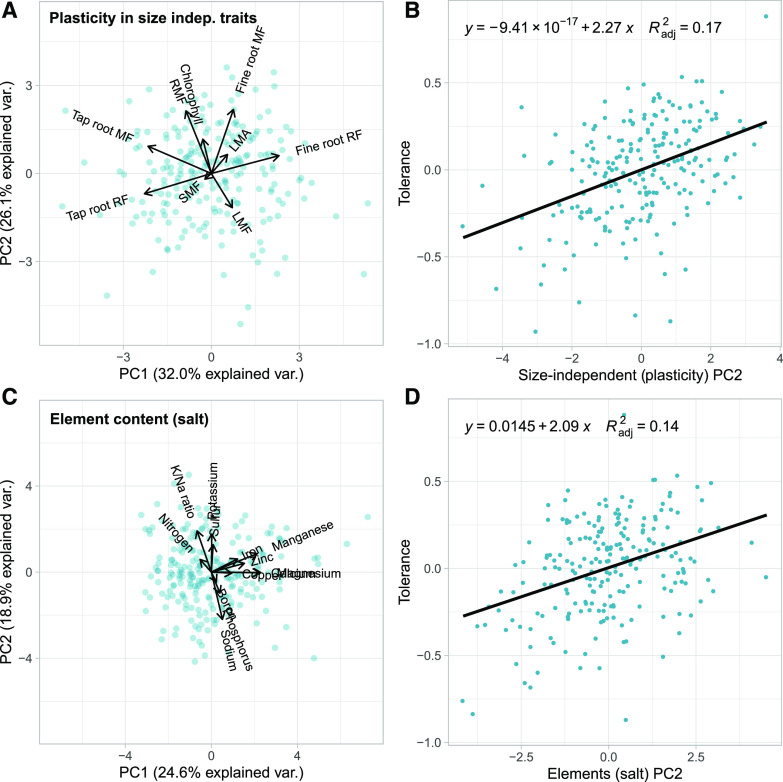
Cultivated sunflower salinity tolerance and associated trait sets. A, Principal component analysis in our cultivated sunflower diversity panel (blue dots) plasticity in size-independent traits (chlorophyll content, fine root allocation [mass fraction and root fraction], LMA, leaf mass fraction (LMF), RMF, SMF, tap root allocation [mass fraction and root fraction]). B, Relationship between salinity tolerance (estimated as expectation-deviation tolerance; the deviation from the expected decrease in biomass due to salinity stress based on vigor in control conditions) and the second principal component of plasticity in size-independent traits. Negative tolerance values indicate more sensitive than expected and positive tolerance values indicate more tolerant than expected. C, Principal component analysis of leaf elemental traits (B, Ca, Cu, Fe, Mg, Mn, N, P, K, Na, S, Zn, and K/Na ratio) of plants grown under salt-stressed (100 mm NaCl) conditions. As above, dots reflect values for individual genotypes. D, Relationship between salinity tolerance and the second principal component of leaf ionomic traits under salt stress. Negative tolerance values indicate more sensitive than expected and positive tolerance values indicate more tolerant than expected.

