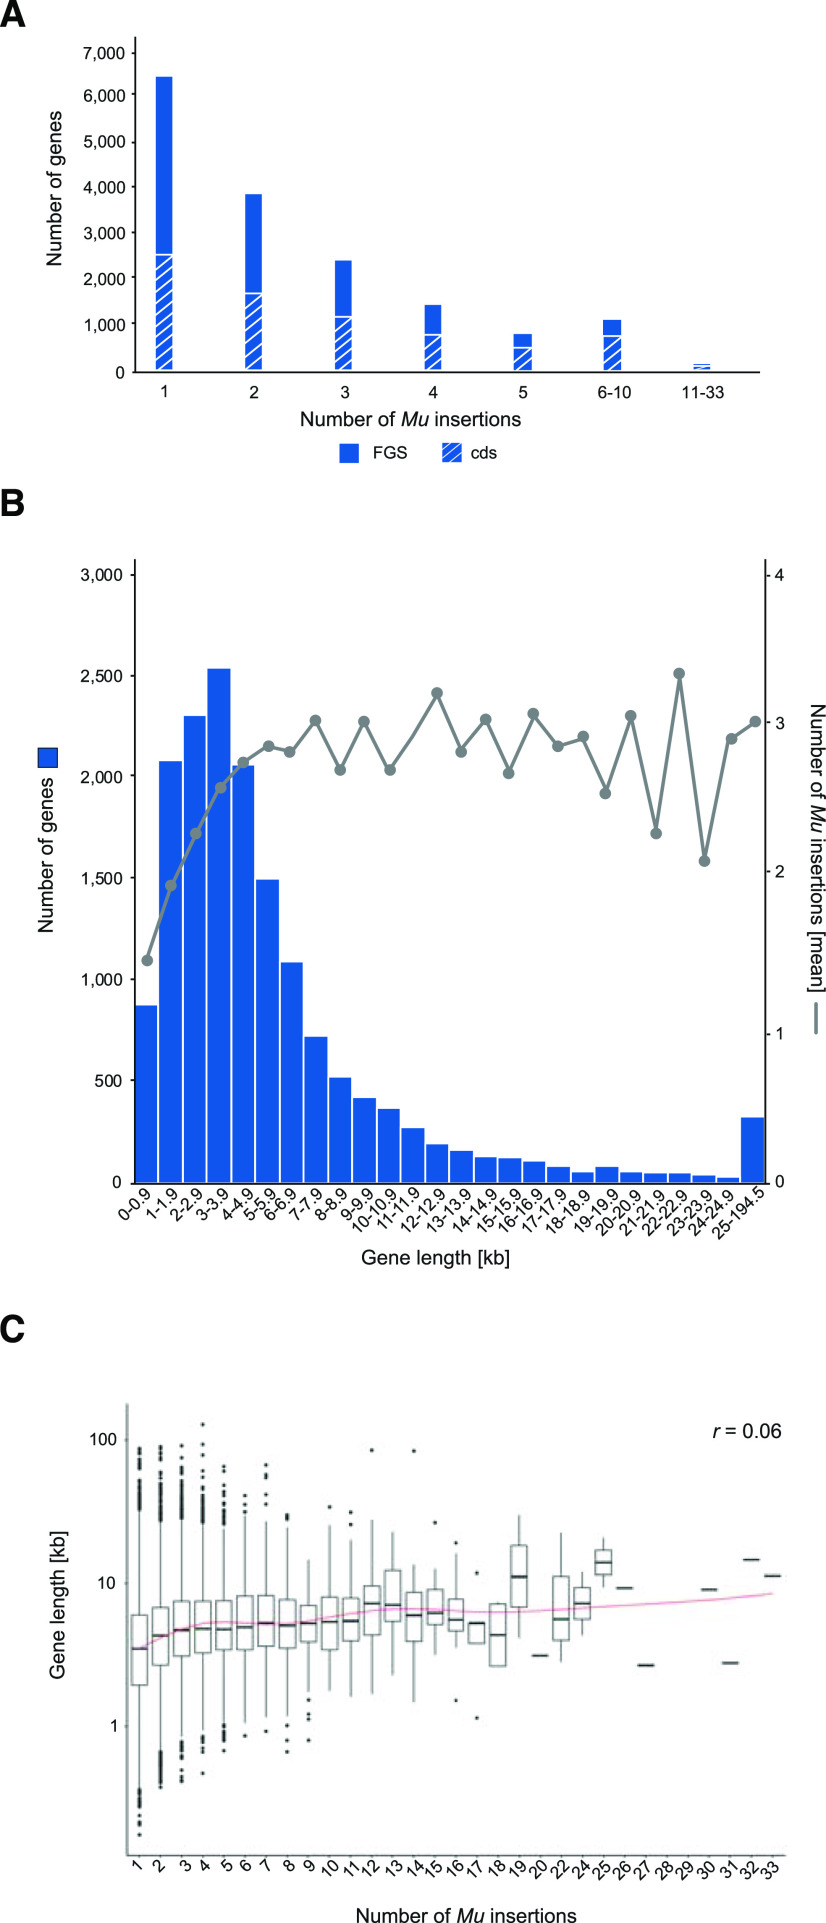
Figure 2.
Number of Mu insertions and its correlation to the length of affected FGS genes of B73. A, Distribution and number of Mu insertions among 16,392 affected FGS genes and the subset of 7,582 genes harboring insertions in the cds of FGS genes. B, Number of tagged genes and associated mean number of Mu insertions plotted against the corresponding gene size. C, Length distribution of affected genes plotted against the individual number of Mu insertions (Pearson correlation coefficient, r = 0.06).

