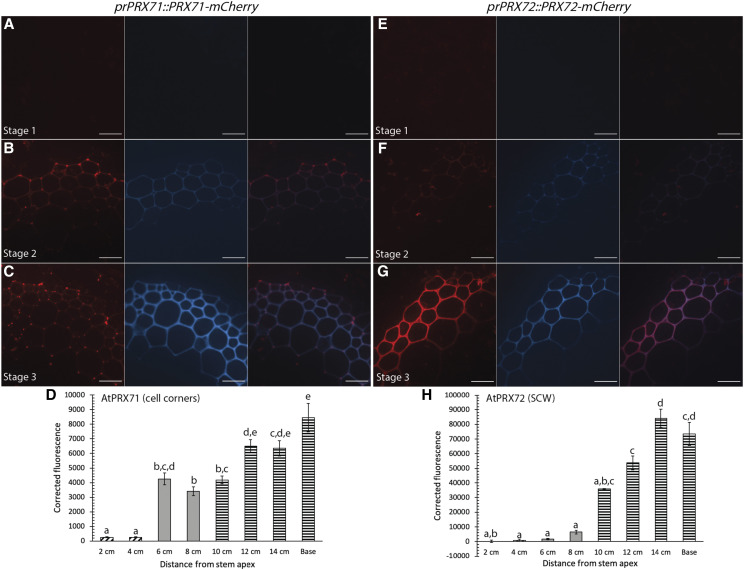
Figure 6.
AtPRX71-mCherry and AtPRX72-mCherry accumulate in different regions of fiber cell walls throughout development of the stem. Representative images depicting tagged PRXs under the respective native promoter (red), UV lignin autofluorescence (blue), and merged image. A to C, AtPRX71-mCherry increases in fluorescence intensity in the cell corners of fibers in stage 1 (A), stage 2 (B), and stage 3 (C) during stem development. D, Quantification of AtPRX71-mCherry cell-corner fluorescence intensity. E to G, AtPRX72-mCherry increases in fluorescence intensity in the SCW of fibers in stage 1 (E), stage 2 (F), and stage 3 (G) during stem development. H, Quantification of AtPRX72-mCherry SCW fluorescence intensity. Corrected fluorescence was measured for n > 30 cells for each developmental timepoint from three biological replicates and compared using a one-way ANOVA; lowercase letters indicate significantly different values according to Tukey-Kramer post-hoc tests (P < 0.05). Bars ± se. Cross-hatched bars indicate stage 1, solid gray bars indicate stage 2, and horizontal bars indicate stage 3. Scale bars = 20 µm.

