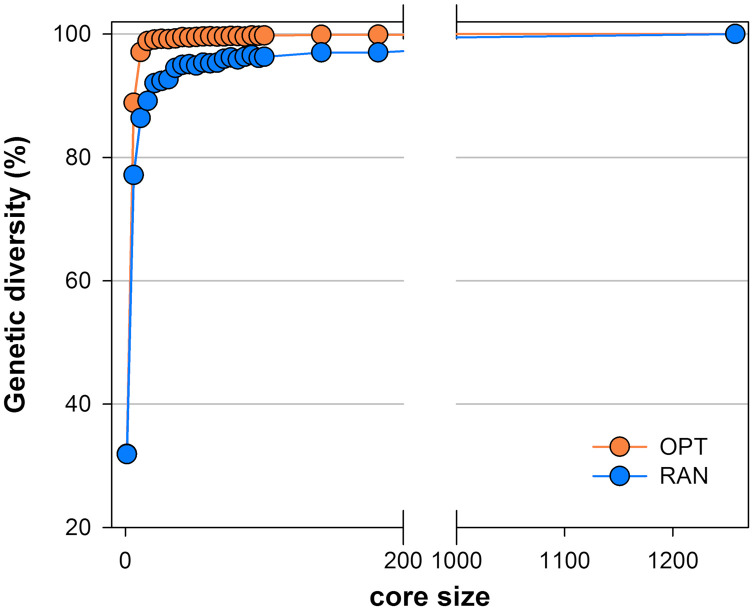
Figure 3.
Assessment of allelic redundancy observed at marker loci in the starting panel (FB_1262). Core collections of incremental size were generated, based on the maximization (OPT) and random sampling (RAN) methods in MSTRAT software, using a set of 445 SNPs. Data points represent averaged values over five independent repetitions for each size.

