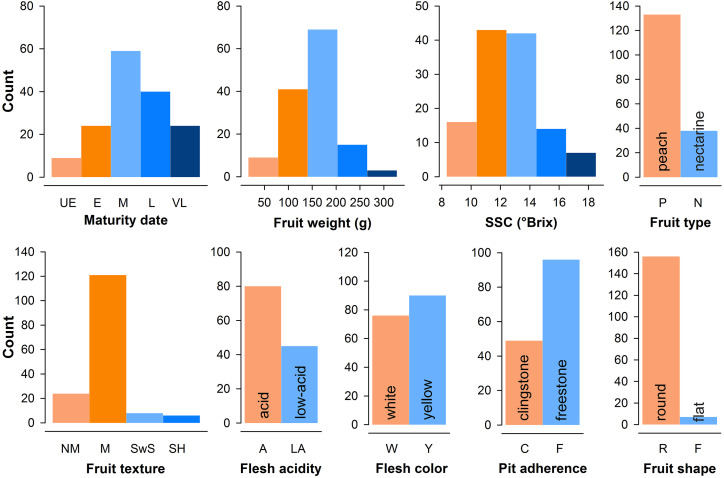
Figure 5.
Distribution of main phenotypic traits in the PRP accessions. In the maturity date plot, UE, E, M, L, and VL indicate ultra-early, early, medium, late, and very late ripening accessions, respectively. SSC, Soluble solids content. In the fruit texture plot, four major texture groups are shown: nonmelting (NM), melting (M), slow softening (SwS), and stony hard (SH).

